
Most Polluted Countries in the World 2024
The average concentration of fine particles (PM2.5) in the air people breathe over the year, weighted by where people live, estimated from satellite observations calibrated to ground monitors by Washington University in St. Louis (SatPM).
Qatar ranks most polluted (75.5 µg/m³), and Greenland cleanest (1.1 µg/m³), of the 217 countries ranked for 2024.
Source: SatPM, Washington University in St. Louis (Atmospheric Composition Analysis Group) · 2024 · CC BY 4.0 · Loaded from the publisher’s file as published; not individually reviewed by SOTW.
- Most polluted
- 75.5 µg/m³
- Qatar
- Cleanest air
- 1.1 µg/m³
- Greenland
- Median country
- 15.9 µg/m³
- of 217
- Countries ranked
- 217
- 2024
Most polluted: top 10
- 1Qatar75.5 µg/m³
- 2Bangladesh65.0 µg/m³
- 3Kuwait57.3 µg/m³
- 4United Arab Emirates55.7 µg/m³
- 5Pakistan53.8 µg/m³
- 6Cameroon51.5 µg/m³
- 7Saudi Arabia50.4 µg/m³
- 8Nigeria50.0 µg/m³
- 9Iraq48.8 µg/m³
- 10Bahrain48.1 µg/m³
Cleanest air: bottom 10
- 217Greenland1.1 µg/m³
- 216Northern Mariana Islands1.5 µg/m³
- 215Guam1.9 µg/m³
- 214Micronesia2.3 µg/m³
- 213Marshall Islands2.8 µg/m³
- 212Palau3.3 µg/m³
- 211French Polynesia3.6 µg/m³
- 210Kiribati3.7 µg/m³
- 207Tonga3.8 µg/m³
- 207Nauru3.8 µg/m³
Map: pm2.5 by country, 2024
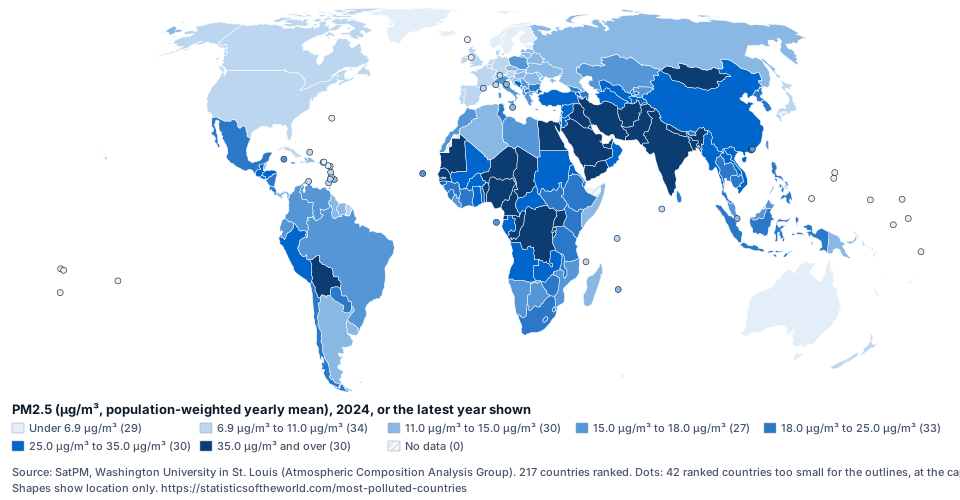
Shaded by fifths of the countries ranked; hatched land has no figure. Source: SatPM, Washington University in St. Louis (Atmospheric Composition Analysis Group).
Full ranking: 217 countries
| Rank | Country | PM2.5 (µg/m³, population-weighted yearly mean), 2024 | Times the WHO guideline | Change since 2014 |
|---|---|---|---|---|
| 1 |  Qatar | 75.5 µg/m³ | 15.1× | +7.1 µg/m³ |
| 2 |  Bangladesh | 65.0 µg/m³ | 13.0× | −4.2 µg/m³ |
| 3 |  Kuwait | 57.3 µg/m³ | 11.5× | +1.0 µg/m³ |
| 4 |  United Arab Emirates | 55.7 µg/m³ | 11.1× | +3.6 µg/m³ |
| 5 |  Pakistan | 53.8 µg/m³ | 10.8× | +5.7 µg/m³ |
| 6 |  Cameroon | 51.5 µg/m³ | 10.3× | +1.2 µg/m³ |
| 7 |  Saudi Arabia | 50.4 µg/m³ | 10.1× | −1.9 µg/m³ |
| 8 |  Nigeria | 50.0 µg/m³ | 10.0× | +2.4 µg/m³ |
| 9 |  Iraq | 48.8 µg/m³ | 9.8× | +2.8 µg/m³ |
| 10 |  Bahrain | 48.1 µg/m³ | 9.6× | +0.2 µg/m³ |
| 11 |  Niger | 47.9 µg/m³ | 9.6× | −0.7 µg/m³ |
| 12 |  India | 44.2 µg/m³ | 8.8× | −7.0 µg/m³ |
| 13 |  Rwanda | 41.8 µg/m³ | 8.4× | −0.2 µg/m³ |
| 14 |  Egypt | 41.3 µg/m³ | 8.3× | −0.1 µg/m³ |
| 15 |  DR Congo | 41.2 µg/m³ | 8.2× | +3.3 µg/m³ |
| 16 |  Nepal | 40.7 µg/m³ | 8.1× | −2.4 µg/m³ |
| 17 |  Bolivia | 40.6 µg/m³ | 8.1× | +15.9 µg/m³ |
| 18 |  Burundi | 40.4 µg/m³ | 8.1× | −0.3 µg/m³ |
| 19 |  Republic of the Congo | 40.3 µg/m³ | 8.1× | +5.3 µg/m³ |
| 20 |  Afghanistan | 40.0 µg/m³ | 8.0× | +8.0 µg/m³ |
| 21 |  Chad | 39.2 µg/m³ | 7.8× | +0.4 µg/m³ |
| 22 |  Mongolia | 38.2 µg/m³ | 7.6× | −1.5 µg/m³ |
| 23 |  Iran | 37.7 µg/m³ | 7.5× | +1.6 µg/m³ |
| 24 |  Uganda | 37.3 µg/m³ | 7.5× | +2.7 µg/m³ |
| 25 |  Senegal | 36.5 µg/m³ | 7.3× | +1.2 µg/m³ |
| 26 |  The Gambia | 35.7 µg/m³ | 7.1× | +1.1 µg/m³ |
| 27 |  Equatorial Guinea | 35.4 µg/m³ | 7.1× | +5.1 µg/m³ |
| 28 |  Benin | 35.3 µg/m³ | 7.1× | +3.8 µg/m³ |
| 29 |  Mauritania | 35.2 µg/m³ | 7.0× | +1.2 µg/m³ |
| 30 |  Yemen | 35.0 µg/m³ | 7.0× | −2.4 µg/m³ |
| 31 |  Burkina Faso | 34.6 µg/m³ | 6.9× | −2.0 µg/m³ |
| 32 |  Oman | 34.1 µg/m³ | 6.8× | +1.7 µg/m³ |
| 33 |  Jordan | 32.6 µg/m³ | 6.5× | +3.7 µg/m³ |
| 33 |  Tajikistan | 32.6 µg/m³ | 6.5× | +4.3 µg/m³ |
| 35 |  Central African Republic | 32.3 µg/m³ | 6.5× | −0.8 µg/m³ |
| 36 |  Gabon | 32.2 µg/m³ | 6.4× | +6.1 µg/m³ |
| 37 |  Armenia | 31.8 µg/m³ | 6.4× | +1.9 µg/m³ |
| 38 |  Honduras | 31.6 µg/m³ | 6.3× | +6.4 µg/m³ |
| 39 |  China | 31.3 µg/m³ | 6.3× | −20.9 µg/m³ |
| 40 |  Myanmar | 31.2 µg/m³ | 6.2× | −1.2 µg/m³ |
| 41 |  Djibouti | 31.1 µg/m³ | 6.2× | −2.5 µg/m³ |
| 42 |  Mali | 31.0 µg/m³ | 6.2× | −3.4 µg/m³ |
| 42 |  Togo | 31.0 µg/m³ | 6.2× | +2.3 µg/m³ |
| 44 |  Syria | 30.8 µg/m³ | 6.2× | +1.3 µg/m³ |
| 45 |  El Salvador | 30.7 µg/m³ | 6.1× | +4.0 µg/m³ |
| 46 |  Uzbekistan | 30.0 µg/m³ | 6.0× | +1.3 µg/m³ |
| 47 |  Turkmenistan | 29.1 µg/m³ | 5.8× | +1.6 µg/m³ |
| 48 |  Guinea-Bissau | 29.0 µg/m³ | 5.8× | +0.6 µg/m³ |
| 49 |  Sudan | 28.8 µg/m³ | 5.8× | −0.3 µg/m³ |
| 50 |  Ghana | 28.2 µg/m³ | 5.6× | +3.6 µg/m³ |
| 51 |  Guatemala | 27.7 µg/m³ | 5.5× | +3.5 µg/m³ |
| 52 |  Peru | 27.6 µg/m³ | 5.5× | +4.4 µg/m³ |
| 53 |  Laos | 27.0 µg/m³ | 5.4× | −1.9 µg/m³ |
| 54 |  Lebanon | 26.2 µg/m³ | 5.2× | −1.4 µg/m³ |
| 55 |  Angola | 26.1 µg/m³ | 5.2× | +6.3 µg/m³ |
| 56 |  Türkiye | 25.6 µg/m³ | 5.1× | +0.1 µg/m³ |
| 56 |  Vietnam | 25.6 µg/m³ | 5.1× | −2.1 µg/m³ |
| 58 |  Zambia | 25.4 µg/m³ | 5.1× | +4.3 µg/m³ |
| 59 |  Bosnia and Herzegovina | 25.2 µg/m³ | 5.0× | −1.9 µg/m³ |
| 60 |  Eritrea | 25.0 µg/m³ | 5.0× | −1.1 µg/m³ |
| 61 |  Bhutan | 24.7 µg/m³ | 4.9× | −5.9 µg/m³ |
| 62 |  Tanzania | 24.6 µg/m³ | 4.9× | +2.1 µg/m³ |
| 63 |  Lesotho | 24.5 µg/m³ | 4.9× | +0.3 µg/m³ |
| 64 |  South Africa | 24.4 µg/m³ | 4.9× | +1.6 µg/m³ |
| 65 |  South Sudan | 24.1 µg/m³ | 4.8× | −0.6 µg/m³ |
| 66 |  Guinea | 23.9 µg/m³ | 4.8× | −0.9 µg/m³ |
| 67 |  Azerbaijan | 23.7 µg/m³ | 4.7× | −1.7 µg/m³ |
| 68 |  Thailand | 23.3 µg/m³ | 4.7× | −1.1 µg/m³ |
| 69 |  Chile | 23.2 µg/m³ | 4.6× | +0.8 µg/m³ |
| 69 |  West Bank and Gaza | 23.2 µg/m³ | 4.6× | +1.4 µg/m³ |
| 71 |  Philippines | 23.1 µg/m³ | 4.6× | +1.0 µg/m³ |
| 72 |  Kenya | 22.0 µg/m³ | 4.4× | +2.4 µg/m³ |
| 73 |  Malawi | 21.8 µg/m³ | 4.4× | +3.1 µg/m³ |
| 74 |  Georgia | 21.5 µg/m³ | 4.3× | −1.9 µg/m³ |
| 75 |  Paraguay | 21.3 µg/m³ | 4.3× | +7.3 µg/m³ |
| 76 |  North Korea | 21.2 µg/m³ | 4.2× | −6.4 µg/m³ |
| 77 |  South Korea | 21.0 µg/m³ | 4.2× | −3.2 µg/m³ |
| 78 |  North Macedonia | 20.7 µg/m³ | 4.1× | −4.4 µg/m³ |
| 78 |  Sri Lanka | 20.7 µg/m³ | 4.1× | −2.3 µg/m³ |
| 80 |  Bulgaria | 20.6 µg/m³ | 4.1× | −3.7 µg/m³ |
| 81 |  Nicaragua | 20.5 µg/m³ | 4.1× | +2.3 µg/m³ |
| 82 |  Israel | 20.4 µg/m³ | 4.1× | +0.4 µg/m³ |
| 83 |  Costa Rica | 20.3 µg/m³ | 4.1× | +1.6 µg/m³ |
| 84 |  Côte d'Ivoire | 20.2 µg/m³ | 4.0× | +2.5 µg/m³ |
| 84 |  Ethiopia | 20.2 µg/m³ | 4.0× | −1.5 µg/m³ |
| 84 |  Sierra Leone | 20.2 µg/m³ | 4.0× | +1.3 µg/m³ |
| 84 |  Tunisia | 20.2 µg/m³ | 4.0× | +3.4 µg/m³ |
| 88 |  Zimbabwe | 20.1 µg/m³ | 4.0× | +3.9 µg/m³ |
| 89 |  Eswatini | 20.0 µg/m³ | 4.0× | +1.6 µg/m³ |
| 90 |  Macao | 19.7 µg/m³ | 3.9× | −12.4 µg/m³ |
| 91 |  Cambodia | 19.0 µg/m³ | 3.8× | +1.3 µg/m³ |
| 92 |  Indonesia | 18.5 µg/m³ | 3.7× | −3.1 µg/m³ |
| 93 |  Mexico | 18.3 µg/m³ | 3.7× | +2.0 µg/m³ |
| 94 |  Ecuador | 17.7 µg/m³ | 3.5× | +0.5 µg/m³ |
| 95 |  Jamaica | 17.6 µg/m³ | 3.5× | −0.6 µg/m³ |
| 95 |  Serbia | 17.6 µg/m³ | 3.5× | −2.9 µg/m³ |
| 97 |  Morocco | 17.4 µg/m³ | 3.5× | +1.3 µg/m³ |
| 98 |  Liberia | 17.2 µg/m³ | 3.4× | +1.8 µg/m³ |
| 98 |  Montenegro | 17.2 µg/m³ | 3.4× | −1.6 µg/m³ |
| 100 |  Libya | 17.1 µg/m³ | 3.4× | +1.1 µg/m³ |
| 101 |  Cabo Verde | 17.0 µg/m³ | 3.4× | +4.8 µg/m³ |
| 101 |  Kyrgyzstan | 17.0 µg/m³ | 3.4× | −0.6 µg/m³ |
| 101 |  Mozambique | 17.0 µg/m³ | 3.4× | +2.9 µg/m³ |
| 104 |  Albania | 16.9 µg/m³ | 3.4× | +0.4 µg/m³ |
| 105 |  Botswana | 16.7 µg/m³ | 3.3× | +4.0 µg/m³ |
| 106 |  Cyprus | 16.6 µg/m³ | 3.3× | −0.6 µg/m³ |
| 106 |  Taiwan | 16.6 µg/m³ | 3.3× | −7.4 µg/m³ |
| 108 |  Kazakhstan | 16.0 µg/m³ | 3.2× | −0.2 µg/m³ |
| 109 |  Kosovo | 15.9 µg/m³ | 3.2× | −7.0 µg/m³ |
| 110 |  Hong Kong | 15.8 µg/m³ | 3.2× | −10.0 µg/m³ |
| 110 |  Venezuela | 15.8 µg/m³ | 3.2× | +0.4 µg/m³ |
| 112 |  Poland | 15.6 µg/m³ | 3.1× | −8.4 µg/m³ |
| 112 |  Sao Tome and Principe | 15.6 µg/m³ | 3.1× | +4.2 µg/m³ |
| 114 |  Namibia | 15.5 µg/m³ | 3.1× | +3.0 µg/m³ |
| 115 |  Brazil | 15.3 µg/m³ | 3.1× | +2.9 µg/m³ |
| 115 |  Malaysia | 15.3 µg/m³ | 3.1× | −4.8 µg/m³ |
| 117 |  Italy | 15.2 µg/m³ | 3.0× | −0.6 µg/m³ |
| 118 |  Colombia | 15.1 µg/m³ | 3.0× | −1.3 µg/m³ |
| 118 |  Greece | 15.1 µg/m³ | 3.0× | −1.2 µg/m³ |
| 120 |  Cayman Islands | 15.0 µg/m³ | 3.0× | 0.0 µg/m³ |
| 121 |  Guyana | 14.8 µg/m³ | 3.0× | +0.4 µg/m³ |
| 122 |  Panama | 14.7 µg/m³ | 2.9× | −0.3 µg/m³ |
| 123 |  Croatia | 14.6 µg/m³ | 2.9× | −2.5 µg/m³ |
| 124 |  Argentina | 14.5 µg/m³ | 2.9× | +0.5 µg/m³ |
| 125 |  Algeria | 14.4 µg/m³ | 2.9× | +1.8 µg/m³ |
| 125 |  Belize | 14.4 µg/m³ | 2.9× | +2.2 µg/m³ |
| 127 |  Romania | 14.3 µg/m³ | 2.9× | −3.1 µg/m³ |
| 128 |  Ukraine | 14.2 µg/m³ | 2.8× | −3.0 µg/m³ |
| 129 |  Haiti | 14.0 µg/m³ | 2.8× | −0.2 µg/m³ |
| 130 |  Slovenia | 13.5 µg/m³ | 2.7× | −1.2 µg/m³ |
| 130 |  Suriname | 13.5 µg/m³ | 2.7× | +0.5 µg/m³ |
| 130 |  Trinidad and Tobago | 13.5 µg/m³ | 2.7× | +1.7 µg/m³ |
| 133 |  Hungary | 13.4 µg/m³ | 2.7× | −6.1 µg/m³ |
| 134 |  Slovakia | 13.2 µg/m³ | 2.6× | −6.5 µg/m³ |
| 135 |  Mauritius | 13.0 µg/m³ | 2.6× | −0.3 µg/m³ |
| 136 |  Belarus | 12.9 µg/m³ | 2.6× | −4.9 µg/m³ |
| 136 |  Russia | 12.9 µg/m³ | 2.6× | +0.2 µg/m³ |
| 136 |  San Marino | 12.9 µg/m³ | 2.6× | −0.2 µg/m³ |
| 139 |  Latvia | 12.7 µg/m³ | 2.5× | −5.5 µg/m³ |
| 140 |  Gibraltar | 12.6 µg/m³ | 2.5× | +2.0 µg/m³ |
| 140 |  Moldova | 12.6 µg/m³ | 2.5× | −3.7 µg/m³ |
| 142 |  Dominican Republic | 12.3 µg/m³ | 2.5× | +0.6 µg/m³ |
| 143 |  Singapore | 12.2 µg/m³ | 2.4× | −3.3 µg/m³ |
| 144 |  Czechia | 12.1 µg/m³ | 2.4× | −6.8 µg/m³ |
| 145 |  Curaçao | 12.0 µg/m³ | 2.4× | +1.8 µg/m³ |
| 146 |  Uruguay | 11.9 µg/m³ | 2.4× | −0.5 µg/m³ |
| 147 |  Lithuania | 11.6 µg/m³ | 2.3× | −5.5 µg/m³ |
| 147 |  Madagascar | 11.6 µg/m³ | 2.3× | +0.1 µg/m³ |
| 149 |  Somalia | 11.5 µg/m³ | 2.3× | −1.5 µg/m³ |
| 150 |  Barbados | 11.2 µg/m³ | 2.2× | +1.6 µg/m³ |
| 151 |  Malta | 11.1 µg/m³ | 2.2× | −0.6 µg/m³ |
| 152 |  Papua New Guinea | 11.0 µg/m³ | 2.2× | +0.2 µg/m³ |
| 153 |  Aruba | 10.9 µg/m³ | 2.2× | +1.6 µg/m³ |
| 154 |  Timor-Leste | 10.8 µg/m³ | 2.2× | −1.0 µg/m³ |
| 155 |  Maldives | 10.7 µg/m³ | 2.1× | −3.3 µg/m³ |
| 155 |  Monaco | 10.7 µg/m³ | 2.1× | −2.0 µg/m³ |
| 157 |  Grenada | 10.6 µg/m³ | 2.1× | +0.9 µg/m³ |
| 158 |  Comoros | 10.5 µg/m³ | 2.1× | +1.1 µg/m³ |
| 158 |  Japan | 10.5 µg/m³ | 2.1× | −2.6 µg/m³ |
| 158 |  Portugal | 10.5 µg/m³ | 2.1× | +2.1 µg/m³ |
| 161 |  Liechtenstein | 10.4 µg/m³ | 2.1× | −0.9 µg/m³ |
| 161 |  St. Lucia | 10.4 µg/m³ | 2.1× | +1.7 µg/m³ |
| 163 |  Austria | 10.3 µg/m³ | 2.1× | −3.5 µg/m³ |
| 164 |  St. Vincent and the Grenadines | 10.2 µg/m³ | 2.0× | +1.0 µg/m³ |
| 165 |  Spain | 10.0 µg/m³ | 2.0× | +0.2 µg/m³ |
| 166 |  Cuba | 9.9 µg/m³ | 2.0× | +0.4 µg/m³ |
| 167 |  Netherlands | 9.6 µg/m³ | 1.9× | −4.3 µg/m³ |
| 168 |  Belgium | 9.3 µg/m³ | 1.9× | −3.6 µg/m³ |
| 169 |  Dominica | 9.1 µg/m³ | 1.8× | +1.0 µg/m³ |
| 169 |  Germany | 9.1 µg/m³ | 1.8× | −4.4 µg/m³ |
| 171 |  Denmark | 9.0 µg/m³ | 1.8× | −2.2 µg/m³ |
| 171 |  Switzerland | 9.0 µg/m³ | 1.8× | −2.2 µg/m³ |
| 173 |  Brunei | 8.9 µg/m³ | 1.8× | −0.9 µg/m³ |
| 173 |  France | 8.9 µg/m³ | 1.8× | −2.7 µg/m³ |
| 175 |  United Kingdom | 8.8 µg/m³ | 1.8× | −3.1 µg/m³ |
| 176 |  Andorra | 8.7 µg/m³ | 1.7× | −0.1 µg/m³ |
| 177 |  Luxembourg | 8.4 µg/m³ | 1.7× | −3.8 µg/m³ |
| 177 |  Turks and Caicos Islands | 8.4 µg/m³ | 1.7× | +1.5 µg/m³ |
| 179 |  Antigua and Barbuda | 7.8 µg/m³ | 1.6× | +0.3 µg/m³ |
| 180 |  United States | 7.5 µg/m³ | 1.5× | −1.0 µg/m³ |
| 181 |  Ireland | 7.4 µg/m³ | 1.5× | −0.4 µg/m³ |
| 182 |  Puerto Rico | 7.3 µg/m³ | 1.5× | +1.0 µg/m³ |
| 183 |  Canada | 7.0 µg/m³ | 1.4× | −0.3 µg/m³ |
| 183 |  New Zealand | 7.0 µg/m³ | 1.4× | +0.1 µg/m³ |
| 183 |  Solomon Islands | 7.0 µg/m³ | 1.4× | −1.0 µg/m³ |
| 186 |  Seychelles | 6.9 µg/m³ | 1.4× | −0.5 µg/m³ |
| 187 |  St. Kitts and Nevis | 6.8 µg/m³ | 1.4× | −0.4 µg/m³ |
| 188 |  Estonia | 6.7 µg/m³ | 1.3× | −3.2 µg/m³ |
| 188 |  Norway | 6.7 µg/m³ | 1.3× | −0.7 µg/m³ |
| 188 |  Sint Maarten | 6.7 µg/m³ | 1.3× | −0.3 µg/m³ |
| 191 |  Saint Martin | 6.6 µg/m³ | 1.3× | −0.2 µg/m³ |
| 192 |  Isle of Man | 6.5 µg/m³ | 1.3× | −1.6 µg/m³ |
| 193 |  U.S. Virgin Islands | 6.1 µg/m³ | 1.2× | +0.6 µg/m³ |
| 194 |  Vanuatu | 5.8 µg/m³ | 1.2× | −1.3 µg/m³ |
| 195 |  British Virgin Islands | 5.7 µg/m³ | 1.1× | +0.6 µg/m³ |
| 195 |  Fiji | 5.7 µg/m³ | 1.1× | +0.4 µg/m³ |
| 195 |  Sweden | 5.7 µg/m³ | 1.1× | −1.9 µg/m³ |
| 198 |  Australia | 5.4 µg/m³ | 1.1× | −0.6 µg/m³ |
| 198 |  Finland | 5.4 µg/m³ | 1.1× | −2.0 µg/m³ |
| 200 |  Bahamas | 5.2 µg/m³ | 1.0× | +0.4 µg/m³ |
| 201 |  New Caledonia | 4.9 µg/m³ | 1.0× | −0.4 µg/m³ |
| 202 |  Iceland | 4.6 µg/m³ | 0.9× | +0.2 µg/m³ |
| 203 |  Tuvalu | 4.5 µg/m³ | 0.9× | −0.4 µg/m³ |
| 204 |  Samoa | 4.1 µg/m³ | 0.8× | 0.0 µg/m³ |
| 205 |  Faroe Islands | 4.0 µg/m³ | 0.8× | −0.9 µg/m³ |
| 206 |  Bermuda | 3.9 µg/m³ | 0.8× | −1.3 µg/m³ |
| 207 |  American Samoa | 3.8 µg/m³ | 0.8× | +0.2 µg/m³ |
| 207 |  Nauru | 3.8 µg/m³ | 0.8× | −1.1 µg/m³ |
| 207 |  Tonga | 3.8 µg/m³ | 0.8× | +0.4 µg/m³ |
| 210 |  Kiribati | 3.7 µg/m³ | 0.7× | −0.6 µg/m³ |
| 211 |  French Polynesia | 3.6 µg/m³ | 0.7× | −0.2 µg/m³ |
| 212 |  Palau | 3.3 µg/m³ | 0.7× | −2.3 µg/m³ |
| 213 |  Marshall Islands | 2.8 µg/m³ | 0.6× | −0.7 µg/m³ |
| 214 |  Micronesia | 2.3 µg/m³ | 0.5× | −1.0 µg/m³ |
| 215 |  Guam | 1.9 µg/m³ | 0.4× | −1.5 µg/m³ |
| 216 |  Northern Mariana Islands | 1.5 µg/m³ | 0.3× | −1.2 µg/m³ |
| 217 |  Greenland | 1.1 µg/m³ | 0.2× | −0.7 µg/m³ |
Countries with the same figure as printed share a rank. The change compares each country’s 2024 figure with its 2014 figure.
About these figures
PM2.5 are particles 2.5 micrometres across or smaller, about a thirtieth of the width of a hair, from fuel burning, industry, traffic, farming, dust storms and wildfires. They reach deep into the lungs and the bloodstream, and long-term exposure raises the risk of heart disease, stroke, lung cancer and respiratory illness.
The World Health Organization’s 2021 guideline for the yearly average is 5 micrograms per cubic metre; the second column shows how many times over it each country’s average is. Its interim targets for countries far above it are 35, 25, 15 and 10.
SatPM combines satellite measurements of how hazy the air is with a chemical transport model and calibrates the result to ground monitors, so it covers countries with few or no monitors. Averages are weighted by population, so they reflect exposure where people live rather than over empty land; desert dust raises the figures of some sparsely monitored countries. The World Bank’s older series on the air pollution by country page uses an earlier estimate and ends sooner.
Every country's history is on the series page, SATPM.L.PM25.A, with the full download through the SOTW API.
Questions
- Which is the most polluted country in the world?
- Qatar, at 75.5 µg/m³, followed by Bangladesh (65.0 µg/m³). Source: SatPM, Washington University in St. Louis (Atmospheric Composition Analysis Group), 2024.
- Which country has the cleanest air?
- Greenland, at 1.1 µg/m³, among the 217 countries ranked. Source: SatPM, Washington University in St. Louis (Atmospheric Composition Analysis Group), 2024.
- Which are the top 10 countries?
- 1. Qatar, 2. Bangladesh, 3. Kuwait, 4. United Arab Emirates, 5. Pakistan, 6. Cameroon, 7. Saudi Arabia, 8. Nigeria, 9. Iraq, 10. Bahrain (2024).