
Oil Consumption by Country 2024
Consumption of petroleum and other liquids (crude oil products, natural gas liquids and biofuels) in thousands of barrels a day, from the U.S. Energy Information Administration’s international energy statistics.
United States ranks first (20,464 thousand barrels a day), followed by China (16,371) and India (5,599), of the 204 countries ranked for 2024. United States accounts for 19.8% of the world total of 103,110 thousand barrels a day.
Source: U.S. Energy Information Administration, International Energy Statistics · 2024 · US government work (public domain) · Loaded from the publisher's file as published; not individually reviewed by SOTW.
- World
- 103,110
- 2024
- Largest consumers
- 20,464
- United States
- Smallest consumers
- 1
- 6 countries
- Countries ranked
- 204
- 2024
Largest consumers: top 10
- 1United States20,464
- 2China16,371
- 3India5,599
- 4Russia3,802
- 5Saudi Arabia3,695
- 6Brazil3,269
- 7Japan3,163
- 8South Korea2,542
- 9Canada2,518
- 10Germany2,040
Smallest consumers: bottom 10
- 199Kiribati1
- 199Nauru1
- 199Micronesia1
- 199Sao Tome and Principe1
- 199Dominica1
- 199British Virgin Islands1
- 192Tonga2
- 192St. Kitts and Nevis2
- 192St. Vincent and the Grenadines2
- 192Solomon Islands2
Map: oil consumption by country, 2024
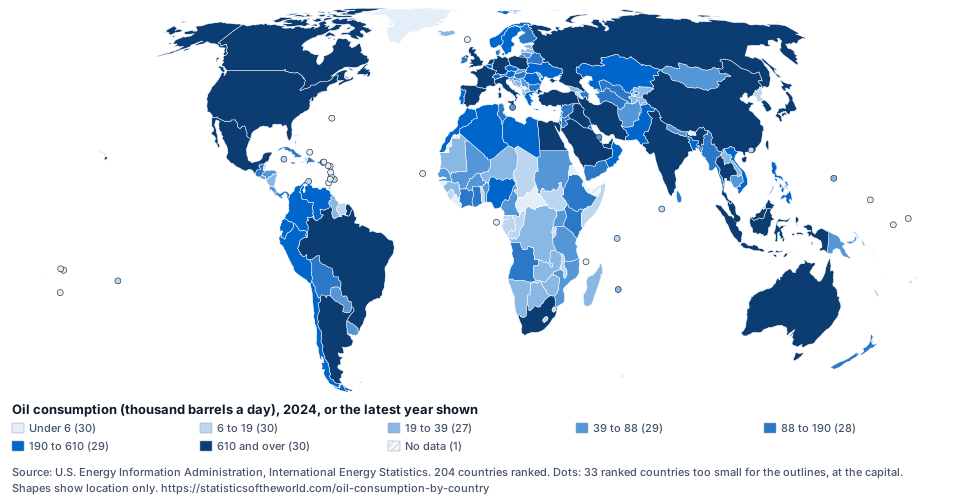
Shaded by fifths of the countries ranked; hatched land has no figure. Source: U.S. Energy Information Administration, International Energy Statistics.
Full ranking: 204 countries
| Rank | Country | Oil consumption (thousand barrels a day), 2024 | Share of world | Change since 2019 |
|---|---|---|---|---|
| 1 |  United States | 20,464 | 19.8% | −0.4% |
| 2 |  China | 16,371 | 15.9% | +17.1% |
| 3 |  India | 5,599 | 5.4% | +13.8% |
| 4 |  Russia | 3,802 | 3.7% | +2.4% |
| 5 |  Saudi Arabia | 3,695 | 3.6% | +4.5% |
| 6 |  Brazil | 3,269 | 3.2% | +8.4% |
| 7 |  Japan | 3,163 | 3.1% | −15.8% |
| 8 |  South Korea | 2,542 | 2.5% | −2.7% |
| 9 |  Canada | 2,518 | 2.4% | −0.8% |
| 10 |  Germany | 2,040 | 2.0% | −13.4% |
| 11 |  Iran | 1,999 | 1.9% | −3.6% |
| 12 |  Mexico | 1,916 | 1.9% | −2.0% |
| 13 |  Indonesia | 1,633 | 1.6% | −0.1% |
| 14 |  France | 1,548 | 1.5% | −9.3% |
| 15 |  Singapore | 1,482 | 1.4% | +3.5% |
| 16 |  United Kingdom | 1,425 | 1.4% | −9.7% |
| 17 |  Thailand | 1,372 | 1.3% | −4.0% |
| 18 |  Spain | 1,314 | 1.3% | −1.1% |
| 19 |  Italy | 1,254 | 1.2% | −0.1% |
| 20 |  Australia | 1,142 | 1.1% | −0.6% |
| 21 |  Türkiye | 1,113 | 1.1% | +12.7% |
| 22 |  Iraq | 1,065 | 1.0% | +8.8% |
| 23 |  Egypt | 959 | 0.9% | +49.9% |
| 24 |  Taiwan | 894 | 0.9% | −13.6% |
| 25 |  United Arab Emirates | 880 | 0.9% | +6.2% |
| 26 |  Netherlands | 854 | 0.8% | −5.0% |
| 27 |  Malaysia | 747 | 0.7% | −6.1% |
| 28 |  Poland | 736 | 0.7% | +5.5% |
| 29 |  Argentina | 735 | 0.7% | +3.2% |
| 30 |  South Africa | 612 | 0.6% | −11.0% |
| 31 |  Belgium | 602 | 0.6% | −6.3% |
| 32 |  Vietnam | 555 | 0.5% | +8.9% |
| 33 |  Nigeria | 493 | 0.5% | +0.8% |
| 34 |  Pakistan | 479 | 0.5% | +3.3% |
| 35 |  Philippines | 473 | 0.5% | +6.1% |
| 36 |  Algeria | 457 | 0.4% | +4.9% |
| 37 |  Kuwait | 438 | 0.4% | −7.0% |
| 38 |  Kazakhstan | 412 | 0.4% | +41.2% |
| 39 |  Chile | 390 | 0.4% | +7.7% |
| 40 |  Colombia | 372 | 0.4% | +8.7% |
| 41 |  Morocco | 321 | 0.3% | +8.5% |
| 42 |  Greece | 309 | 0.3% | −0.1% |
| 43 |  Bangladesh | 291 | 0.3% | +45.8% |
| 44 |  Ecuador | 288 | 0.3% | +18.0% |
| 45 |  Sweden | 279 | 0.3% | −5.9% |
| 45 |  Hong Kong | 279 | 0.3% | −30.7% |
| 47 |  Qatar | 276 | 0.3% | +9.4% |
| 48 |  Peru | 264 | 0.3% | +5.2% |
| 49 |  Austria | 241 | 0.2% | −13.1% |
| 50 |  Venezuela | 234 | 0.2% | −43.5% |
| 51 |  Oman | 231 | 0.2% | +13.6% |
| 52 |  Czechia | 224 | 0.2% | +2.0% |
| 53 |  Portugal | 223 | 0.2% | −10.4% |
| 53 |  Libya | 223 | 0.2% | +2.3% |
| 53 |  Romania | 223 | 0.2% | +0.2% |
| 56 |  Israel | 222 | 0.2% | −4.6% |
| 57 |  Norway | 215 | 0.2% | −5.9% |
| 58 |  Ukraine | 206 | 0.2% | −21.9% |
| 59 |  Switzerland | 194 | 0.2% | −11.8% |
| 60 |  Finland | 179 | 0.2% | −14.2% |
| 61 |  Hungary | 173 | 0.2% | −4.0% |
| 62 |  New Zealand | 160 | 0.2% | −11.3% |
| 63 |  Ireland | 156 | 0.2% | −1.9% |
| 64 |  Denmark | 149 | 0.1% | −7.7% |
| 65 |  Dominican Republic | 148 | 0.1% | −0.7% |
| 66 |  Turkmenistan | 146 | 0.1% | +2.8% |
| 67 |  Uzbekistan | 136 | 0.1% | +39.5% |
| 68 |  Panama | 135 | 0.1% | −20.2% |
| 69 |  Angola | 129 | 0.1% | +6.9% |
| 70 |  Myanmar | 125 | 0.1% | −12.5% |
| 71 |  Guatemala | 124 | 0.1% | +14.9% |
| 71 |  Syria | 124 | 0.1% | −4.6% |
| 73 |  Cuba | 117 | 0.1% | −18.0% |
| 74 |  Belarus | 116 | 0.1% | −14.6% |
| 74 |  Kenya | 116 | 0.1% | −2.8% |
| 76 |  Lebanon | 114 | 0.1% | −32.2% |
| 77 |  Azerbaijan | 112 | 0.1% | +14.3% |
| 78 |  Bulgaria | 108 | 0.1% | +7.8% |
| 79 |  Bolivia | 104 | 0.1% | +14.6% |
| 79 |  Ethiopia | 104 | 0.1% | +3.2% |
| 81 |  Ghana | 103 | 0.10% | +18.6% |
| 81 |  Tunisia | 103 | 0.10% | −0.8% |
| 83 |  Yemen | 101 | 0.10% | −12.2% |
| 83 |  Jordan | 101 | 0.10% | −6.2% |
| 85 |  Puerto Rico | 94 | 0.09% | +19.5% |
| 86 |  Côte d'Ivoire | 93 | 0.09% | +69.4% |
| 87 |  Sri Lanka | 92 | 0.09% | −24.3% |
| 88 |  Gibraltar | 88 | 0.09% | +6.2% |
| 89 |  Serbia | 87 | 0.08% | +11.7% |
| 90 |  Sudan | 86 | 0.08% | −40.2% |
| 91 |  Tanzania | 84 | 0.08% | +28.0% |
| 92 |  Slovakia | 82 | 0.08% | −3.5% |
| 92 |  Croatia | 82 | 0.08% | +14.8% |
| 94 |  Honduras | 81 | 0.08% | +21.7% |
| 95 |  Senegal | 76 | 0.07% | +38.4% |
| 96 |  Cambodia | 74 | 0.07% | +13.2% |
| 97 |  Bahrain | 70 | 0.07% | +6.6% |
| 98 |  Lithuania | 68 | 0.07% | 0.0% |
| 99 |  Costa Rica | 65 | 0.06% | +8.5% |
| 100 |  Nepal | 61 | 0.06% | +34.9% |
| 101 |  El Salvador | 60 | 0.06% | +2.4% |
| 102 |  Afghanistan | 58 | 0.06% | −2.9% |
| 103 |  Uruguay | 55 | 0.05% | +6.6% |
| 104 |  Paraguay | 52 | 0.05% | −6.8% |
| 105 |  Slovenia | 50 | 0.05% | −8.9% |
| 106 |  Luxembourg | 49 | 0.05% | −23.7% |
| 107 |  Mongolia | 48 | 0.05% | +34.7% |
| 108 |  Benin | 47 | 0.05% | +0.1% |
| 108 |  Malta | 47 | 0.05% | −13.0% |
| 110 |  Mali | 46 | 0.05% | +25.5% |
| 110 |  Cyprus | 46 | 0.04% | −1.8% |
| 112 |  Jamaica | 44 | 0.04% | −24.6% |
| 112 |  Uganda | 44 | 0.04% | +9.1% |
| 114 |  Papua New Guinea | 43 | 0.04% | +2.5% |
| 115 |  Mozambique | 42 | 0.04% | +28.3% |
| 116 |  Burkina Faso | 39 | 0.04% | +25.7% |
| 116 |  Cameroon | 39 | 0.04% | +0.1% |
| 116 |  Georgia | 39 | 0.04% | +24.1% |
| 119 |  Zimbabwe | 38 | 0.04% | +41.3% |
| 120 |  Bosnia and Herzegovina | 37 | 0.04% | +11.1% |
| 120 |  Zambia | 37 | 0.04% | +34.4% |
| 122 |  Nicaragua | 36 | 0.03% | +5.3% |
| 123 |  West Bank and Gaza | 34 | 0.03% | +38.4% |
| 124 |  Latvia | 33 | 0.03% | −17.4% |
| 124 |  Tajikistan | 33 | 0.03% | +26.8% |
| 126 |  Guinea | 31 | 0.03% | +10.7% |
| 126 |  Mauritania | 31 | 0.03% | +9.1% |
| 128 |  Kyrgyzstan | 30 | 0.03% | −5.4% |
| 129 |  Mauritius | 28 | 0.03% | −10.5% |
| 129 |  Estonia | 28 | 0.03% | +1.2% |
| 131 |  Trinidad and Tobago | 27 | 0.03% | −8.0% |
| 131 |  Guyana | 27 | 0.03% | +42.4% |
| 133 |  DR Congo | 25 | 0.02% | +40.0% |
| 133 |  Albania | 25 | 0.02% | −5.9% |
| 135 |  Namibia | 24 | 0.02% | −6.9% |
| 135 |  Moldova | 24 | 0.02% | +10.6% |
| 135 |  North Macedonia | 24 | 0.02% | +4.7% |
| 135 |  Laos | 24 | 0.02% | −1.2% |
| 139 |  Botswana | 23 | 0.02% | +5.7% |
| 140 |  Bahamas | 22 | 0.02% | +8.4% |
| 140 |  Guam | 22 | 0.02% | +14.2% |
| 142 |  Iceland | 21 | 0.02% | +5.6% |
| 143 |  Niger | 20 | 0.02% | +27.4% |
| 144 |  Madagascar | 19 | 0.02% | +6.6% |
| 144 |  North Korea | 19 | 0.02% | −6.7% |
| 144 |  Armenia | 19 | 0.02% | +87.6% |
| 147 |  New Caledonia | 17 | 0.02% | −4.4% |
| 148 |  U.S. Virgin Islands | 16 | 0.02% | −0.2% |
| 148 |  Brunei | 16 | 0.02% | −11.6% |
| 148 |  Gabon | 16 | 0.02% | −0.2% |
| 148 |  Togo | 16 | 0.02% | +82.1% |
| 152 |  Fiji | 15 | 0.01% | +12.9% |
| 152 |  Suriname | 15 | 0.01% | −1.6% |
| 154 |  Republic of the Congo | 14 | 0.01% | +45.8% |
| 155 |  Chad | 13 | 0.01% | +11.3% |
| 155 |  Maldives | 13 | 0.01% | +23.9% |
| 157 |  South Sudan | 12 | 0.01% | −1.7% |
| 157 |  Haiti | 12 | 0.01% | −46.7% |
| 159 |  Somalia | 11 | 0.01% | +28.3% |
| 159 |  Sierra Leone | 11 | 0.01% | +39.7% |
| 159 |  Macao | 11 | 0.01% | −14.1% |
| 159 |  Malawi | 11 | 0.01% | +12.7% |
| 163 |  Barbados | 10 | 0.01% | −3.9% |
| 163 |  Rwanda | 10 | 0.01% | +31.8% |
| 165 |  Montenegro | 9 | 0.01% | +10.3% |
| 165 |  French Polynesia | 9 | 0.01% | +45.3% |
| 167 |  Aruba | 8 | 0.01% | +5.1% |
| 168 |  Seychelles | 6 | 0.01% | +5.7% |
| 168 |  Equatorial Guinea | 6 | 0.01% | −9.8% |
| 168 |  Eswatini | 6 | 0.01% | −7.4% |
| 168 |  Cayman Islands | 6 | 0.01% | +3.8% |
| 168 |  Burundi | 6 | 0.01% | +22.5% |
| 168 |  Lesotho | 6 | 0.01% | +7.1% |
| 168 |  Belize | 6 | 0.01% | −0.9% |
| 175 |  Bhutan | 5 | 0.01% | +22.8% |
| 175 |  Faroe Islands | 5 | 0.01% | +3.6% |
| 175 |  Antigua and Barbuda | 5 | 0.00% | +2.7% |
| 175 |  Eritrea | 5 | 0.00% | +21.1% |
| 175 |  Liberia | 5 | 0.00% | −18.0% |
| 175 |  Cabo Verde | 5 | 0.00% | −16.4% |
| 175 |  Djibouti | 5 | 0.00% | −5.1% |
| 175 |  Timor-Leste | 5 | 0.00% | +3.1% |
| 183 |  St. Lucia | 4 | 0.00% | +5.4% |
| 183 |  American Samoa | 4 | 0.00% | +26.7% |
| 183 |  Bermuda | 4 | 0.00% | −12.6% |
| 183 |  The Gambia | 4 | 0.00% | +15.5% |
| 183 |  Greenland | 4 | 0.00% | −4.2% |
| 188 |  Turks and Caicos Islands | 3 | 0.00% | +1.1% |
| 188 |  Central African Republic | 3 | 0.00% | +23.5% |
| 188 |  Grenada | 3 | 0.00% | +9.0% |
| 188 |  Comoros | 3 | 0.00% | +73.0% |
| 192 |  Guinea-Bissau | 2 | 0.00% | +28.9% |
| 192 |  Samoa | 2 | 0.00% | −4.4% |
| 192 |  Vanuatu | 2 | 0.00% | +47.0% |
| 192 |  Solomon Islands | 2 | 0.00% | +0.8% |
| 192 |  St. Vincent and the Grenadines | 2 | 0.00% | +16.5% |
| 192 |  St. Kitts and Nevis | 2 | 0.00% | +3.8% |
| 192 |  Tonga | 2 | 0.00% | +3.4% |
| 199 |  British Virgin Islands | 1 | 0.00% | +3.2% |
| 199 |  Dominica | 1 | 0.00% | +2.0% |
| 199 |  Sao Tome and Principe | 1 | 0.00% | +11.9% |
| 199 |  Micronesia | 1 | 0.00% | +2.9% |
| 199 |  Nauru | 1 | 0.00% | +19.4% |
| 199 |  Kiribati | 1 | 0.00% | +13.7% |
Countries with the same figure as printed share a rank. Shares are of the source’s world total for the same year. The change compares each country’s 2024 figure with its 2019 figure, in percent.
About these figures
Consumption covers fuel burned for transport, heating, power and industry, and oil used as a raw material for plastics and chemicals, whether refined at home or imported as products.
A barrel is 159 litres (42 US gallons). Shares are of the EIA’s world total for the same year.
Every country's history is on the series page, EIA.L.INTL.PETROLEUM.CONS.A, with the full download through the SOTW API.
Questions
- Which country uses the most oil?
- United States, at 20,464 thousand barrels a day, followed by China (16,371). Source: U.S. Energy Information Administration, International Energy Statistics, 2024.
- What is the world total?
- 103,110 thousand barrels a day in 2024, as published by the source. The five largest countries account for 48.4% of it.
- Which are the top 10 countries?
- 1. United States, 2. China, 3. India, 4. Russia, 5. Saudi Arabia, 6. Brazil, 7. Japan, 8. South Korea, 9. Canada, 10. Germany (2024).