
Natural Gas Production by Country 2024
Dry natural gas production (the gas left after liquids are separated out, as it is sold to users), from the U.S. Energy Information Administration’s international energy statistics.
United States ranks first (37,767 billion cubic feet), followed by Russia (22,674) and Iran (9,853), of the 96 countries ranked for 2024. United States accounts for 25.4% of the world total of 148,970 billion cubic feet.
Source: U.S. Energy Information Administration, International Energy Statistics · 2024 · US government work (public domain) · Loaded from the publisher's file as published; not individually reviewed by SOTW.
- World
- 148,970
- 2024
- Largest producers
- 37,767
- United States
- Smallest producers
- 0
- 8 countries
- Countries ranked
- 96
- 2024
Largest producers: top 10
- 1United States37,767
- 2Russia22,674
- 3Iran9,853
- 4China9,127
- 5Canada7,026
- 6Qatar6,002
- 7Australia5,374
- 8Norway4,623
- 9Saudi Arabia4,357
- 10Algeria3,489
Map: dry natural gas production by country, 2024
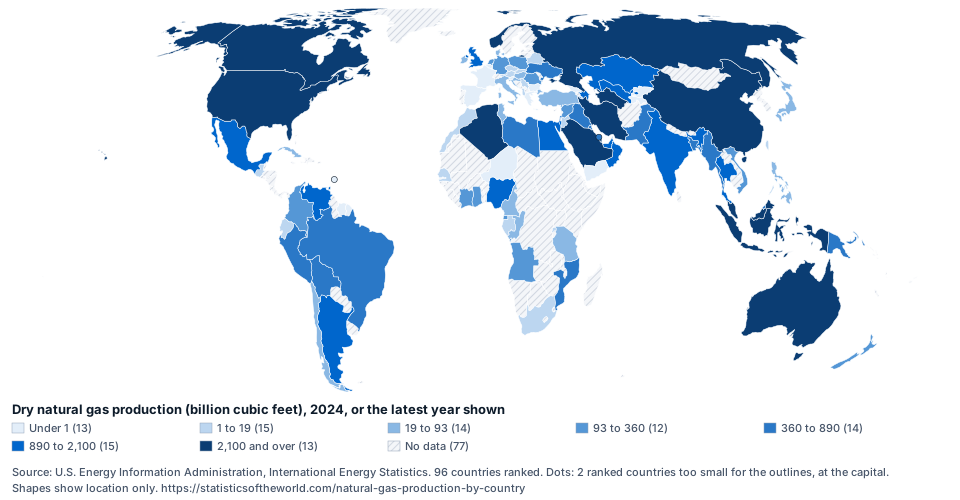
Shaded by fifths of the countries ranked; hatched land has no figure. Source: U.S. Energy Information Administration, International Energy Statistics.
Full ranking: 96 countries
| Rank | Country | Dry natural gas production (billion cubic feet), 2024 | Billion cubic metres | Share of world | Change since 2019 |
|---|---|---|---|---|---|
| 1 |  United States | 37,767 | 1,069.4 | 25.4% | +11.4% |
| 2 |  Russia | 22,674 | 642.0 | 15.2% | −9.4% |
| 3 |  Iran | 9,853 | 279.0 | 6.6% | +18.8% |
| 4 |  China | 9,127 | 258.4 | 6.1% | +44.1% |
| 5 |  Canada | 7,026 | 199.0 | 4.7% | +15.8% |
| 6 |  Qatar | 6,002 | 170.0 | 4.0% | +1.5% |
| 7 |  Australia | 5,374 | 152.2 | 3.6% | +4.9% |
| 8 |  Norway | 4,623 | 130.9 | 3.1% | +8.7% |
| 9 |  Saudi Arabia | 4,357 | 123.4 | 2.9% | +9.4% |
| 10 |  Algeria | 3,489 | 98.8 | 2.3% | +11.0% |
| 11 |  Malaysia | 2,846 | 80.6 | 1.9% | +12.1% |
| 12 |  Turkmenistan | 2,740 | 77.6 | 1.8% | −7.2% |
| 13 |  Indonesia | 2,465 | 69.8 | 1.7% | +4.0% |
| 14 |  United Arab Emirates | 2,098 | 59.4 | 1.4% | +6.9% |
| 15 |  Egypt | 1,676 | 47.5 | 1.1% | −27.3% |
| 16 |  Argentina | 1,652 | 46.8 | 1.1% | +7.0% |
| 17 |  Uzbekistan | 1,631 | 46.2 | 1.1% | −17.4% |
| 18 |  Oman | 1,566 | 44.3 | 1.1% | +22.2% |
| 19 |  Nigeria | 1,380 | 39.1 | 0.9% | −15.6% |
| 20 |  Azerbaijan | 1,338 | 37.9 | 0.9% | +64.1% |
| 21 |  India | 1,269 | 35.9 | 0.9% | +15.0% |
| 22 |  Mexico | 1,105 | 31.3 | 0.7% | +3.3% |
| 23 |  United Kingdom | 1,088 | 30.8 | 0.7% | −21.7% |
| 24 |  Kazakhstan | 1,033 | 29.3 | 0.7% | +26.2% |
| 25 |  Thailand | 953 | 27.0 | 0.6% | −29.6% |
| 26 |  Israel | 940 | 26.6 | 0.6% | +158.9% |
| 27 |  Venezuela | 898 | 25.4 | 0.6% | +27.9% |
| 28 |  Trinidad and Tobago | 893 | 25.3 | 0.6% | −29.1% |
| 29 |  Pakistan | 852 | 24.1 | 0.6% | −21.1% |
| 30 |  Brazil | 782 | 22.1 | 0.5% | −11.3% |
| 31 |  Bangladesh | 711 | 20.1 | 0.5% | −22.2% |
| 32 |  Kuwait | 703 | 19.9 | 0.5% | +13.7% |
| 33 |  Bahrain | 677 | 19.2 | 0.5% | +7.9% |
| 34 |  Ukraine | 642 | 18.2 | 0.4% | −8.0% |
| 35 |  Peru | 479 | 13.6 | 0.3% | +1.0% |
| 36 |  Myanmar | 455 | 12.9 | 0.3% | −25.8% |
| 37 |  Mozambique | 430 | 12.2 | 0.3% | +124.4% |
| 38 |  Libya | 427 | 12.1 | 0.3% | −18.5% |
| 39 |  Papua New Guinea | 403 | 11.4 | 0.3% | −0.9% |
| 40 |  Bolivia | 394 | 11.2 | 0.3% | −28.9% |
| 41 |  Brunei | 371 | 10.5 | 0.2% | −18.1% |
| 42 |  Iraq | 365 | 10.3 | 0.2% | −3.6% |
| 43 |  Colombia | 356 | 10.1 | 0.2% | −12.1% |
| 44 |  Netherlands | 342 | 9.7 | 0.2% | −70.8% |
| 45 |  Romania | 323 | 9.2 | 0.2% | −5.3% |
| 46 |  Equatorial Guinea | 235 | 6.7 | 0.2% | +10.9% |
| 47 |  Vietnam | 225 | 6.4 | 0.2% | −34.5% |
| 48 |  Angola | 205 | 5.8 | 0.1% | −14.3% |
| 49 |  Poland | 184 | 5.2 | 0.1% | −9.4% |
| 50 |  Germany | 146 | 4.1 | 0.10% | −31.2% |
| 51 |  Syria | 132 | 3.7 | 0.09% | +6.1% |
| 52 |  Ghana | 121 | 3.4 | 0.08% | +128.0% |
| 53 |  New Zealand | 118 | 3.3 | 0.08% | −29.9% |
| 54 |  Côte d'Ivoire | 96 | 2.7 | 0.06% | +18.8% |
| 55 |  Italy | 93 | 2.6 | 0.06% | −45.5% |
| 56 |  Cameroon | 89 | 2.5 | 0.06% | +6.7% |
| 57 |  Türkiye | 80 | 2.3 | 0.05% | +377.2% |
| 58 |  Denmark | 79 | 2.2 | 0.05% | −33.6% |
| 59 |  Tanzania | 70 | 2.0 | 0.05% | +44.5% |
| 60 |  Japan | 67 | 1.9 | 0.05% | −24.6% |
| 61 |  Republic of the Congo | 63 | 1.8 | 0.04% | +53.4% |
| 62 |  Hungary | 61 | 1.7 | 0.04% | +1.1% |
| 63 |  Philippines | 59 | 1.7 | 0.04% | −60.9% |
| 64 |  Tunisia | 41 | 1.2 | 0.03% | +4.3% |
| 65 |  Ireland | 39 | 1.1 | 0.03% | −58.6% |
| 65 |  Chile | 39 | 1.1 | 0.03% | −22.4% |
| 67 |  Cuba | 34 | 1.0 | 0.02% | +1.3% |
| 68 |  Croatia | 23 | 0.7 | 0.02% | −36.4% |
| 69 |  Austria | 19 | 0.5 | 0.01% | −42.0% |
| 70 |  Gabon | 17 | 0.5 | 0.01% | +2.9% |
| 71 |  Serbia | 11 | 0.3 | 0.01% | −30.2% |
| 72 |  Ecuador | 9 | 0.3 | 0.01% | −22.3% |
| 73 |  Jordan | 8 | 0.2 | 0.01% | +86.2% |
| 74 |  Czechia | 6 | 0.2 | 0.00% | −13.2% |
| 75 |  Rwanda | 3 | 0.1 | 0.00% | +49.9% |
| 75 |  Guatemala | 3 | 0.1 | 0.00% | +3.3% |
| 77 |  Belarus | 2 | 0.1 | 0.00% | +0.4% |
| 77 |  Taiwan | 2 | 0.1 | 0.00% | −53.9% |
| 77 |  South Africa | 2 | 0.1 | 0.00% | −95.3% |
| 77 |  Albania | 2 | 0.1 | 0.00% | −30.1% |
| 77 |  Morocco | 2 | 0.0 | 0.00% | −59.3% |
| 82 |  Slovakia | 1 | 0.0 | 0.00% | −45.9% |
| 82 |  Senegal | 1 | 0.0 | 0.00% | −46.8% |
| 82 |  Kyrgyzstan | 1 | 0.0 | 0.00% | +22.0% |
| 82 |  Spain | 1 | 0.0 | 0.00% | −77.9% |
| 82 |  Niger | 1 | 0.0 | 0.00% | −30.6% |
| 82 |  Tajikistan | 1 | 0.0 | 0.00% | −1.8% |
| 82 |  Belgium | 1 | 0.0 | 0.00% | +286.4% |
| 89 |  France | 0 | 0.0 | 0.00% | −22.2% |
| 89 |  Yemen | 0 | 0.0 | 0.00% | +0.9% |
| 89 |  Georgia | 0 | 0.0 | 0.00% | +14.7% |
| 89 |  Bulgaria | 0 | 0.0 | 0.00% | −76.2% |
| 89 |  Suriname | 0 | 0.0 | 0.00% | +17.0% |
| 89 |  Barbados | 0 | 0.0 | 0.00% | −85.5% |
| 89 |  Slovenia | 0 | 0.0 | 0.00% | −66.9% |
| 89 |  Greece | 0 | 0.0 | 0.00% | −82.3% |
Countries with the same figure as printed share a rank. Shares are of the source’s world total for the same year. The change compares each country’s 2024 figure with its 2019 figure, in percent.
Not ranked because the latest figure is more than 2 years older than 2024: Afghanistan (2020).
Not ranked because the source gives zero: 109 countries, among them American Samoa, Antigua and Barbuda, Armenia, Aruba, Bahamas, Belize, Benin, Bermuda.
About these figures
Dry gas excludes gas flared, vented or pumped back into wells, and the natural gas liquids separated from it, so it measures the gas that reaches pipelines and LNG terminals.
One billion cubic feet is about 28.3 million cubic metres; the cubic metre column converts the EIA figure. Shares are of the EIA’s world total for the same year.
Every country's history is on the series page, EIA.L.INTL.GAS.PROD.A, with the full download through the SOTW API.
Questions
- Which country produces the most natural gas?
- United States, at 37,767 billion cubic feet, followed by Russia (22,674). Source: U.S. Energy Information Administration, International Energy Statistics, 2024.
- What is the world total?
- 148,970 billion cubic feet in 2024, as published by the source. The five largest countries account for 58.0% of it.
- Which are the top 10 countries?
- 1. United States, 2. Russia, 3. Iran, 4. China, 5. Canada, 6. Qatar, 7. Australia, 8. Norway, 9. Saudi Arabia, 10. Algeria (2024).