
Child Stunting by Country
The share of children under five who are stunted, too short for their age by the World Health Organization’s child growth standards, from national household surveys compiled in WHO’s Global Database on Child Growth and Malnutrition.
Burundi ranks highest (52.8%, 2024), and Latvia lowest (0.5%, 2021), of the 136 countries ranked on their latest national survey.
Source: World Health Organization, Global Health Observatory · latest survey · WHO terms of use · Read from SOTW’s hash-verified capture of the publisher’s release.
- Highest
- 52.8%
- Burundi
- Lowest
- 0.5%
- Latvia
- Median country
- 14.7%
- of 136
- Countries ranked
- 136
- latest survey
Highest: top 10
- 1Burundi52.8%
- 2Yemen48.5%
- 3Niger47.7%
- 4Timor-Leste46.7%
- 5Guatemala46.0%
- 6DR Congo44.7%
- 7Afghanistan44.6%
- 8Madagascar39.8%
- 9Sudan38.2%
- 10Central African Republic37.9%
Lowest: bottom 10
- 136Latvia0.5%
- 135South Korea0.9%
- 133Poland1.0%
- 133Lithuania1.0%
- 131Estonia1.2%
- 131Belarus1.2%
- 130Germany1.3%
- 129Chile1.8%
- 128Belgium1.9%
- 127United Kingdom2.0%
Map: stunting by country, latest survey
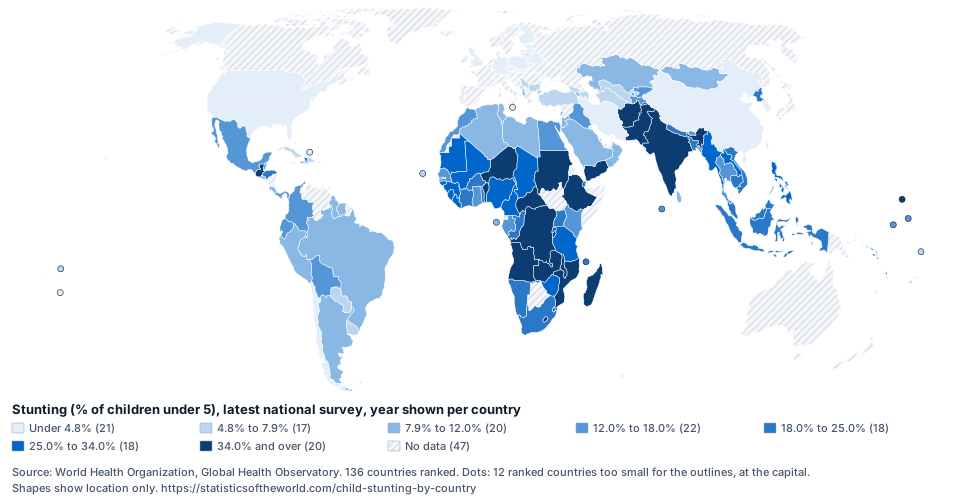
Shaded by fifths of the countries ranked; hatched land has no figure. Source: World Health Organization, Global Health Observatory.
Full ranking: 136 countries
| Rank | Country | Stunting (% of children under 5), latest survey | Uncertainty range |
|---|---|---|---|
| 1 |  Burundi | 52.8%(2024) | 51.4% to 54.3% |
| 2 |  Yemen | 48.5%(2022) | 47.2% to 49.8% |
| 3 |  Niger | 47.7%(2022) | 44.9% to 50.5% |
| 4 |  Timor-Leste | 46.7%(2020) | 45.3% to 48.1% |
| 5 |  Guatemala | 46.0%(2021) | n/a |
| 6 |  DR Congo | 44.7%(2023) | n/a |
| 7 |  Afghanistan | 44.6%(2022) | 43.6% to 45.6% |
| 8 |  Madagascar | 39.8%(2021) | 38.0% to 41.7% |
| 9 |  Sudan | 38.2%(2014) | 36.4% to 40.1% |
| 10 |  Central African Republic | 37.9%(2022) | 36.4% to 39.4% |
| 11 |  Angola | 37.6%(2015) | 35.7% to 39.5% |
| 11 |  Pakistan | 37.6%(2018) | 34.8% to 40.6% |
| 13 |  Ethiopia | 36.8%(2019) | 34.3% to 39.4% |
| 14 |  Mozambique | 36.7%(2022) | 34.4% to 39.1% |
| 15 |  Lesotho | 35.6%(2024) | 32.6% to 38.6% |
| 16 |  India | 35.5%(2020) | 35.1% to 35.8% |
| 16 |  Malawi | 35.5%(2020) | 34.2% to 36.9% |
| 18 |  Marshall Islands | 34.8%(2017) | 30.6% to 39.2% |
| 19 |  Zambia | 34.6%(2018) | 33.4% to 35.8% |
| 20 |  Benin | 34.1%(2021) | 32.8% to 35.4% |
| 21 |  Nigeria | 33.8%(2021) | 30.9% to 36.8% |
| 22 |  Rwanda | 33.1%(2020) | 31.4% to 34.9% |
| 23 |  Laos | 32.8%(2023) | n/a |
| 24 |  Chad | 31.9%(2022) | 30.3% to 33.6% |
| 25 |  Solomon Islands | 31.7%(2015) | 29.4% to 34.1% |
| 26 |  Tanzania | 30.0%(2022) | 28.0% to 32.1% |
| 27 |  Liberia | 29.8%(2019) | 27.3% to 32.5% |
| 28 |  Cameroon | 28.9%(2018) | 27.1% to 30.8% |
| 28 |  Vanuatu | 28.9%(2013) | 25.1% to 33.0% |
| 30 |  Guinea-Bissau | 28.1%(2019) | 25.8% to 30.6% |
| 31 |  Myanmar | 26.7%(2018) | 25.3% to 28.2% |
| 31 |  Philippines | 26.7%(2021) | 25.2% to 28.2% |
| 33 |  Sierra Leone | 26.3%(2021) | 24.9% to 27.6% |
| 34 |  Guinea | 26.1%(2022) | 24.5% to 27.8% |
| 35 |  Zimbabwe | 25.9%(2024) | n/a |
| 36 |  Djibouti | 25.5%(2023) | 22.9% to 28.2% |
| 37 |  Mali | 25.1%(2024) | n/a |
| 37 |  Mauritania | 25.1%(2022) | 25.0% to 25.2% |
| 39 |  Nepal | 24.8%(2022) | 22.7% to 27.0% |
| 40 |  Uganda | 24.4%(2022) | n/a |
| 41 |  Togo | 23.8%(2017) | 21.9% to 25.7% |
| 42 |  Bangladesh | 23.6%(2022) | 22.0% to 25.2% |
| 43 |  Côte d'Ivoire | 23.4%(2021) | 21.8% to 25.1% |
| 44 |  Namibia | 22.7%(2013) | 20.8% to 24.8% |
| 45 |  Haiti | 22.0%(2023) | 20.8% to 23.2% |
| 45 |  Indonesia | 22.0%(2023) | 21.7% to 22.3% |
| 47 |  Cambodia | 21.9%(2021) | 20.2% to 23.7% |
| 48 |  South Africa | 21.3%(2017) | 18.7% to 24.2% |
| 49 |  Malaysia | 21.2%(2022) | 20.0% to 22.6% |
| 49 |  Republic of the Congo | 21.2%(2014) | 19.7% to 22.7% |
| 51 |  Burkina Faso | 21.1%(2021) | 19.9% to 22.4% |
| 52 |  Eswatini | 20.0%(2021) | 18.3% to 21.9% |
| 53 |  North Korea | 19.1%(2017) | n/a |
| 54 |  Honduras | 18.7%(2019) | 17.6% to 19.9% |
| 55 |  Comoros | 18.2%(2022) | 16.5% to 19.9% |
| 55 |  Vietnam | 18.2%(2023) | n/a |
| 57 |  Bhutan | 17.9%(2023) | n/a |
| 58 |  Kenya | 17.6%(2022) | 16.8% to 18.4% |
| 59 |  Senegal | 17.5%(2023) | 16.0% to 19.0% |
| 59 |  The Gambia | 17.5%(2020) | 15.8% to 19.2% |
| 61 |  Ecuador | 17.4%(2024) | 16.7% to 18.3% |
| 61 |  Ghana | 17.4%(2022) | 15.9% to 19.0% |
| 63 |  Bolivia | 16.1%(2016) | 14.9% to 17.3% |
| 64 |  Panama | 15.9%(2019) | 14.1% to 17.8% |
| 65 |  Nauru | 15.7%(2023) | 11.5% to 21.2% |
| 66 |  Maldives | 15.3%(2017) | 13.5% to 17.2% |
| 67 |  Kiribati | 15.2%(2018) | 13.5% to 17.1% |
| 68 |  Belize | 15.0%(2015) | 12.9% to 17.3% |
| 69 |  Gabon | 14.4%(2020) | 12.9% to 15.9% |
| 70 |  Morocco | 14.2%(2019) | n/a |
| 71 |  Kyrgyzstan | 14.1%(2023) | 12.4% to 16.0% |
| 72 |  Lebanon | 13.9%(2023) | 11.6% to 16.6% |
| 73 |  Tajikistan | 13.7%(2023) | n/a |
| 74 |  Egypt | 12.8%(2021) | 12.0% to 13.7% |
| 75 |  Colombia | 12.7%(2016) | 11.8% to 13.7% |
| 76 |  Iraq | 12.6%(2018) | 11.4% to 14.0% |
| 77 |  Mexico | 12.5%(2022) | 10.5% to 14.8% |
| 78 |  Thailand | 12.4%(2022) | 11.1% to 14.0% |
| 79 |  Sao Tome and Principe | 11.7%(2019) | 10.0% to 13.8% |
| 80 |  Peru | 11.5%(2023) | 11.0% to 12.2% |
| 81 |  Oman | 11.4%(2017) | 9.8% to 13.1% |
| 82 |  Albania | 11.3%(2017) | 9.7% to 13.1% |
| 83 |  Saudi Arabia | 10.8%(2020) | 9.7% to 12.1% |
| 84 |  Sri Lanka | 10.5%(2024) | n/a |
| 85 |  El Salvador | 10.0%(2021) | n/a |
| 86 |  Algeria | 9.8%(2019) | 9.0% to 10.7% |
| 87 |  Guyana | 9.5%(2019) | 7.9% to 11.5% |
| 88 |  Armenia | 9.4%(2016) | 7.8% to 11.3% |
| 89 |  Costa Rica | 9.0%(2018) | 6.5% to 12.4% |
| 90 |  Mongolia | 8.8%(2023) | n/a |
| 91 |  Argentina | 8.7%(2018) | 7.4% to 10.1% |
| 91 |  West Bank and Gaza | 8.7%(2020) | 7.9% to 9.6% |
| 93 |  Tunisia | 8.4%(2018) | 7.2% to 9.8% |
| 94 |  Suriname | 8.3%(2018) | 6.8% to 10.1% |
| 95 |  Jordan | 8.2%(2023) | 7.1% to 9.6% |
| 96 |  Brazil | 8.0%(2019) | 7.1% to 8.9% |
| 96 |  Kazakhstan | 8.0%(2015) | 7.0% to 9.2% |
| 98 |  Libya | 7.9%(2022) | 7.1% to 8.9% |
| 99 |  Samoa | 7.3%(2019) | 6.1% to 8.8% |
| 100 |  Fiji | 7.2%(2021) | 5.7% to 9.0% |
| 100 |  Montenegro | 7.2%(2018) | 3.5% to 14.2% |
| 100 |  Turkmenistan | 7.2%(2019) | 6.2% to 8.3% |
| 103 |  Cuba | 7.1%(2019) | 5.7% to 8.8% |
| 104 |  Bulgaria | 7.0%(2014) | n/a |
| 105 |  Uruguay | 6.9%(2018) | 6.0% to 8.0% |
| 106 |  Dominican Republic | 6.7%(2019) | 6.0% to 7.5% |
| 107 |  Azerbaijan | 6.6%(2023) | 5.3% to 8.0% |
| 108 |  Uzbekistan | 6.5%(2021) | 5.8% to 7.3% |
| 109 |  Qatar | 6.2%(2023) | 6.0% to 6.5% |
| 110 |  Cabo Verde | 6.0%(2018) | n/a |
| 110 |  Türkiye | 6.0%(2018) | 4.9% to 7.3% |
| 112 |  Georgia | 5.8%(2018) | 4.4% to 7.5% |
| 113 |  Tuvalu | 5.7%(2019) | 3.9% to 8.3% |
| 114 |  Paraguay | 5.6%(2016) | 4.6% to 6.8% |
| 115 |  Serbia | 5.4%(2019) | 3.8% to 7.6% |
| 116 |  China | 4.8%(2017) | n/a |
| 116 |  Iran | 4.8%(2017) | n/a |
| 118 |  Jamaica | 4.6%(2018) | 3.1% to 6.8% |
| 118 |  Turks and Caicos Islands | 4.6%(2020) | 1.0% to 18.2% |
| 120 |  North Macedonia | 4.3%(2019) | 2.8% to 6.5% |
| 121 |  United States | 3.8%(2022) | 2.0% to 6.6% |
| 122 |  Malta | 3.3%(2022) | 2.4% to 4.4% |
| 123 |  Kuwait | 3.2%(2023) | 2.6% to 3.9% |
| 123 |  Portugal | 3.2%(2016) | 1.7% to 6.0% |
| 125 |  Finland | 2.8%(2023) | n/a |
| 126 |  Tonga | 2.2%(2019) | 1.3% to 3.6% |
| 127 |  United Kingdom | 2.0%(2019) | 1.9% to 2.0% |
| 128 |  Belgium | 1.9%(2023) | 0.6% to 6.3% |
| 129 |  Chile | 1.8%(2014) | n/a |
| 130 |  Germany | 1.3%(2016) | 0.5% to 3.1% |
| 131 |  Belarus | 1.2%(2023) | n/a |
| 131 |  Estonia | 1.2%(2014) | 0.7% to 2.2% |
| 133 |  Lithuania | 1.0%(2023) | 1.0% to 1.1% |
| 133 |  Poland | 1.0%(2018) | 0.6% to 1.8% |
| 135 |  South Korea | 0.9%(2020) | 0.4% to 1.9% |
| 136 |  Latvia | 0.5%(2021) | 0.1% to 3.6% |
Each figure is from the country's latest national survey; its year is in brackets.
The uncertainty range is the publisher's own interval around its estimate; countries whose ranges overlap may not truly differ.
Countries with the same figure as printed share a rank.
Not ranked because the latest figure is more than 10 years older than the most common survey year, 2023: Australia (2007), Bahrain (1995), Barbados (2012), Bosnia and Herzegovina (2012), Botswana (2007), Brunei (2009), Czechia (2001), Equatorial Guinea (2011), Eritrea (2010), Greece (2003), Ireland (2011), Japan (2010), Mauritius (1995), Moldova (2012), Netherlands (2009), Nicaragua (2012), Papua New Guinea (2010), Romania (2002), Seychelles (2012), Singapore (2000), Somalia (2009), South Sudan (2010), St. Lucia (2012), Syria (2010), Trinidad and Tobago (2011), Ukraine (2000), Venezuela (2009).
About these figures
A child is stunted when their height is more than two standard deviations below the median of the WHO child growth standards for their age and sex. Stunting reflects long-term undernutrition, repeated infections and poor maternal health, and its effects on growth and development are largely irreversible after the first two years.
These are survey estimates, not modelled ones: each figure comes from the country’s latest national survey that measured children, so years differ and the year column matters. Many high-income countries run no such surveys and have no figure.
Every country's history is on the series page, WHO.CHILD_STUNTING, with the full download through the SOTW API.
Questions
- Which country has the highest child stunting rate?
- Burundi, at 52.8% (2024), followed by Yemen (48.5%). Source: World Health Organization, Global Health Observatory, latest survey.
- Which country has the lowest child stunting rate?
- Latvia, at 0.5% (2021), among the 136 countries ranked. Source: World Health Organization, Global Health Observatory, latest survey.
- Which are the top 10 countries?
- 1. Burundi, 2. Yemen, 3. Niger, 4. Timor-Leste, 5. Guatemala, 6. DR Congo, 7. Afghanistan, 8. Madagascar, 9. Sudan, 10. Central African Republic (latest survey).