
Malaria Cases by Country 2024
Estimated new malaria cases a year per 1,000 people living in areas at risk, from the World Health Organization’s World Malaria Report, for the countries where malaria is still transmitted.
Benin ranks highest (354.3 cases per 1,000 at risk), followed by Burkina Faso (353.5) and Mali (346.2), of the 80 countries ranked for 2024.
Source: World Health Organization, Global Health Observatory · 2024 · WHO terms of use · Read from SOTW’s hash-verified capture of the publisher’s release.
- Highest
- 354.3
- Benin
- Lowest
- 0.0
- 4 countries
- Median country
- 48.6
- of 80
- Countries ranked
- 80
- 2024
Highest: top 10
- 1Benin354.3
- 2Burkina Faso353.5
- 3Mali346.2
- 4Central African Republic343.8
- 5DR Congo321.9
- 6Burundi314.9
- 7Niger305.1
- 8Mozambique295.1
- 9Malawi294.5
- 10Nigeria294.3
Lowest: bottom 10
- 77Vietnam0.0
- 77Nepal0.0
- 77Cambodia0.0
- 77Ecuador0.0
- 72Mexico0.1
- 72South Africa0.1
- 72Laos0.1
- 72Costa Rica0.1
- 72Cabo Verde0.1
- 67South Korea0.2
Map: malaria incidence by country, 2024
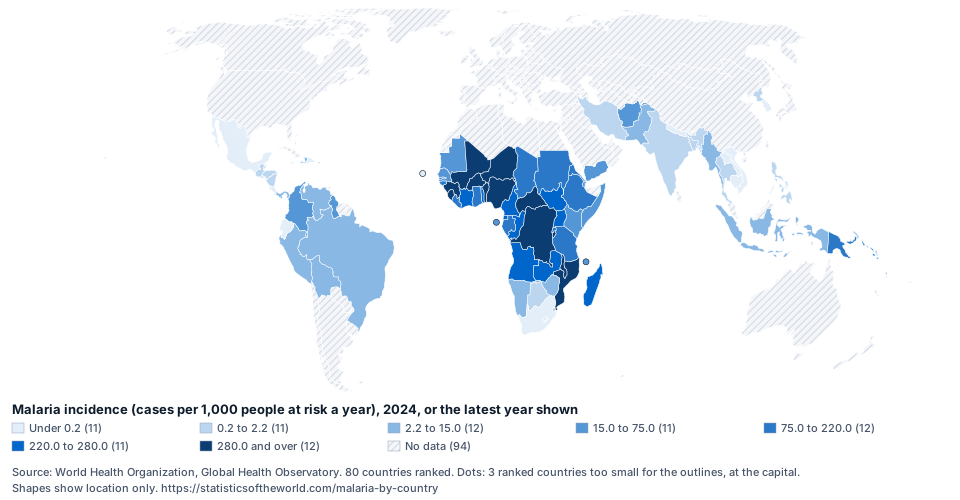
Shaded by fifths of the countries ranked; hatched land has no figure. Source: World Health Organization, Global Health Observatory.
Full ranking: 80 countries
| Rank | Country | Malaria incidence (cases per 1,000 people at risk a year), 2024 | Uncertainty range |
|---|---|---|---|
| 1 |  Benin | 354.3 | 227.9 to 527.5 |
| 2 |  Burkina Faso | 353.5 | 233.9 to 512.0 |
| 3 |  Mali | 346.2 | 244.0 to 492.4 |
| 4 |  Central African Republic | 343.8 | 168.8 to 638.3 |
| 5 |  DR Congo | 321.9 | 243.1 to 416.9 |
| 6 |  Burundi | 314.9 | 188.0 to 497.4 |
| 7 |  Niger | 305.1 | 177.2 to 499.5 |
| 8 |  Mozambique | 295.1 | 223.3 to 377.5 |
| 9 |  Malawi | 294.5 | 191.3 to 431.3 |
| 10 |  Nigeria | 294.3 | 211.0 to 397.4 |
| 11 |  Guinea | 286.1 | 198.1 to 400.7 |
| 12 |  Sierra Leone | 282.7 | 153.6 to 474.1 |
| 13 |  Côte d'Ivoire | 267.9 | 178.3 to 388.5 |
| 14 |  Uganda | 264.2 | 154.2 to 426.6 |
| 15 |  Cameroon | 260.5 | 190.3 to 349.4 |
| 16 |  Angola | 258.9 | 160.3 to 392.1 |
| 17 |  Madagascar | 255.4 | 163.2 to 354.7 |
| 18 |  South Sudan | 254.1 | 153.0 to 390.4 |
| 19 |  Zambia | 252.4 | 203.3 to 312.1 |
| 20 |  Togo | 249.3 | 166.3 to 357.0 |
| 21 |  Equatorial Guinea | 227.7 | 148.9 to 333.8 |
| 22 |  Solomon Islands | 224.3 | 189.9 to 269.2 |
| 23 |  Republic of the Congo | 221.0 | 130.6 to 350.3 |
| 24 |  Chad | 206.1 | 121.6 to 330.1 |
| 25 |  Ghana | 195.8 | 135.6 to 274.0 |
| 26 |  Gabon | 187.0 | 102.1 to 313.3 |
| 27 |  Liberia | 172.3 | 103.4 to 268.0 |
| 28 |  Papua New Guinea | 151.8 | 105.5 to 202.0 |
| 29 |  Ethiopia | 138.5 | 76.6 to 207.6 |
| 30 |  Tanzania | 136.7 | 97.1 to 188.5 |
| 31 |  Guinea-Bissau | 110.1 | 30.6 to 295.9 |
| 32 |  Eritrea | 102.4 | 65.7 to 142.8 |
| 33 |  Sudan | 98.3 | 56.4 to 159.7 |
| 34 |  Rwanda | 77.1 | 60.0 to 95.0 |
| 35 |  The Gambia | 75.4 | 58.7 to 93.9 |
| 36 |  Kenya | 74.2 | 37.3 to 131.0 |
| 37 |  Mauritania | 69.6 | 32.9 to 120.4 |
| 38 |  Comoros | 62.8 | 62.8 to 62.8 |
| 39 |  Somalia | 53.3 | 28.5 to 92.2 |
| 40 |  Yemen | 52.2 | 32.5 to 80.9 |
| 41 |  Djibouti | 45.1 | 45.1 to 45.1 |
| 42 |  Guyana | 38.7 | 32.9 to 45.1 |
| 43 |  Senegal | 36.8 | 28.9 to 45.3 |
| 44 |  Sao Tome and Principe | 30.1 | 30.1 to 30.1 |
| 45 |  Afghanistan | 17.8 | 13.7 to 22.6 |
| 46 |  Colombia | 15.2 | 11.6 to 19.0 |
| 47 |  Myanmar | 14.8 | 8.9 to 62.0 |
| 48 |  Pakistan | 12.8 | 10.1 to 17.2 |
| 49 |  Vanuatu | 12.2 | 7.4 to 19.2 |
| 50 |  Zimbabwe | 11.4 | 6.8 to 16.4 |
| 51 |  Haiti | 8.7 | 5.3 to 13.6 |
| 52 |  Venezuela | 7.8 | 6.9 to 9.0 |
| 53 |  Namibia | 7.2 | 5.7 to 8.8 |
| 54 |  Bolivia | 3.8 | 3.0 to 4.7 |
| 54 |  Brazil | 3.8 | 3.4 to 4.1 |
| 56 |  Panama | 3.5 | 3.5 to 3.5 |
| 57 |  Peru | 3.2 | 2.7 to 3.9 |
| 58 |  Indonesia | 2.2 | 2.1 to 2.4 |
| 58 |  Iran | 2.2 | 2.2 to 2.2 |
| 60 |  India | 1.5 | 1.1 to 1.9 |
| 61 |  Nicaragua | 1.0 | 0.9 to 1.2 |
| 62 |  Bangladesh | 0.9 | 0.7 to 1.0 |
| 63 |  Thailand | 0.6 | 0.6 to 0.6 |
| 63 |  Eswatini | 0.6 | 0.6 to 0.6 |
| 65 |  North Korea | 0.5 | 0.5 to 0.5 |
| 66 |  Philippines | 0.4 | 0.2 to 0.5 |
| 67 |  Honduras | 0.2 | 0.2 to 0.2 |
| 67 |  Guatemala | 0.2 | 0.2 to 0.2 |
| 67 |  Botswana | 0.2 | 0.2 to 0.3 |
| 67 |  Dominican Republic | 0.2 | 0.2 to 0.2 |
| 67 |  South Korea | 0.2 | 0.2 to 0.2 |
| 72 |  Cabo Verde | 0.1 | 0.1 to 0.1 |
| 72 |  Costa Rica | 0.1 | 0.1 to 0.1 |
| 72 |  Laos | 0.1 | 0.1 to 0.2 |
| 72 |  South Africa | 0.1 | 0.1 to 0.1 |
| 72 |  Mexico | 0.1 | 0.1 to 0.1 |
| 77 |  Ecuador | 0.0 | 0.0 to 0.0 |
| 77 |  Cambodia | 0.0 | 0.0 to 0.0 |
| 77 |  Nepal | 0.0 | 0.0 to 0.0 |
| 77 |  Vietnam | 0.0 | 0.0 to 0.0 |
The uncertainty range is the publisher's own interval around its estimate; countries whose ranges overlap may not truly differ.
Countries with the same figure as printed share a rank.
Not ranked because the source gives zero: 28 countries, among them Algeria, Argentina, Armenia, Azerbaijan, Belize, Bhutan, China, Egypt.
About these figures
Only countries with ongoing malaria transmission are listed; countries certified malaria-free, and those that have never had local transmission, have no figure. The rate is per person living in an area at risk, not per resident, so a country where only some regions carry malaria can still show a high rate.
Where health systems report cases well, the estimates start from reported cases adjusted for testing and for people who do not seek care; where reporting is weak, they are modelled from surveys that test for the parasite. Each estimate comes with an uncertainty range, often a wide one.
Every country's history is on the series page, WHO.MALARIA_INCIDENCE, with the full download through the SOTW API.
Questions
- Which country has the highest malaria rate?
- Benin, at 354.3 cases per 1,000 people at risk a year, followed by Burkina Faso (353.5). Source: World Health Organization, Global Health Observatory, 2024.
- Which are the top 10 countries?
- 1. Benin, 2. Burkina Faso, 3. Mali, 4. Central African Republic, 5. DR Congo, 6. Burundi, 7. Niger, 8. Mozambique, 9. Malawi, 10. Nigeria (2024).