
OECD Countries: All 38 Members
The OECD has 38 members. Their combined nominal GDP is $78.03 trillion for 2026 (IMF projection), 61.5% of the $126.88 trillion total for the 189 economies SOTW covers. Together they had 1.40 billion people in 2025, 17.1% of the world's population in SOTW's data. The United States has both the largest economy and the most people. Luxembourg has the highest GDP per person, $155,733 (2026 IMF projection).
All 38 member countries. Each year is when that country ratified the OECD Convention; Costa Rica, in 2021, is the latest accession. Source: OECD: members and partners, checked October 21, 2026.
- Members
- 38
- Checked October 21, 2026
- Combined GDP
- $78.03T
- 2026 (IMF projection), 61.5% of covered world
- Population
- 1.40 billion
- 2025, 17.1% of covered world
- Newest member
- Costa Rica
- Joined in 2021
All 38 OECD members
Where the OECD members are
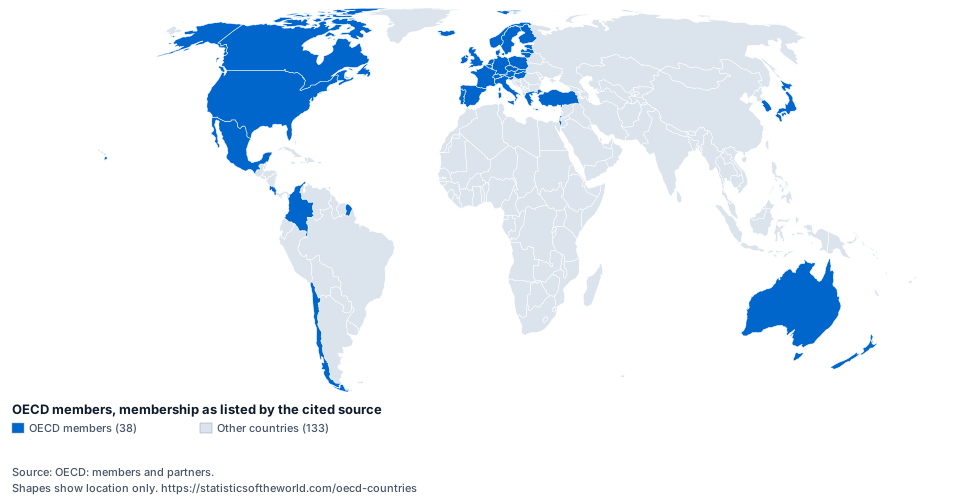
Embed this map
<a href="https://statisticsoftheworld.com/oecd-countries"><img src="https://statisticsoftheworld.com/maps/group-oecd.svg" width="960" height="500" alt="World map of the OECD members. Source: OECD: members and partners."></a>
<p>Source: OECD: members and partners. Map: <a href="https://statisticsoftheworld.com/oecd-countries">Statistics of the World</a></p>
Richest OECD countries by GDP per person
Luxembourg has the highest GDP per person among the OECD members: $155,733 (2026 IMF projection). Luxembourg is also highest at purchasing power parity, which adjusts for price levels ($156,638).
| # | Country | GDP per personcurrent US dollars | Year | GDP per person at PPPinternational dollars (PPP) |
|---|---|---|---|---|
| 1 | Luxembourg | $155,733 | 2026 (IMF projection) | $156,638rank 1 |
| 2 | Ireland | $127,837 | 2026 (IMF projection) | $149,642rank 2 |
| 3 | Switzerland | $124,478 | 2026 (IMF projection) | $106,944rank 4 |
| 4 | Norway | $115,188 | 2026 (IMF projection) | $116,169rank 3 |
| 5 | Iceland | $107,464 | 2026 (IMF projection) | $83,002rank 8 |
| 6 | United States | $95,212 | 2026 (IMF projection) | $95,212rank 5 |
| 7 | Denmark | $82,714 | 2026 (IMF projection) | $92,876rank 6 |
| 8 | Netherlands | $78,535 | 2026 (IMF projection) | $88,202rank 7 |
| 9 | Australia | $75,172 | 2026 (IMF projection) | $75,039rank 13 |
| 10 | Israel | $72,441 | 2026 (IMF projection) | $60,100rank 24 |
Income inequality in OECD countries
Colombia has the highest Gini index of income inequality among the OECD members: 54.4 (2024). Iceland, New Zealand and Hungary have no figure and are not ranked.
| # | Country | Gini index0 (equal) to 100 | Year |
|---|---|---|---|
| 1 | Colombia | 54.4 | 2024 |
| 2 | Costa Rica | 45.5 | 2025 |
| 3 | Türkiye | 43.7 | 2023 |
| 4 | Chile | 43.0 | 2024 |
| 5 | Mexico | 42.6 | 2024 |
| 6 | United States | 41.8 | 2024 |
| 7 | Israel | 38.3 | 2022 |
| 8 | Lithuania | 36.0 | 2023 |
| 9 | Italy | 34.3 | 2023 |
| 10 | Latvia | 34.0 | 2023 |
When each country joined the OECD
19 countries have been members since 1961; the most recent to join was Costa Rica, in 2021. The OECD has enlarged 14 times since 1961.
| Year | Countries | Members after |
|---|---|---|
| 1961 | Austria, Belgium, Canada, Denmark, France, Germany, Greece, Iceland, Ireland, Luxembourg, Netherlands, Norway, Portugal, Spain, Sweden, Switzerland, Türkiye, United Kingdom, United States | 19 |
| 1962 | Italy | 20 |
| 1964 | Japan | 21 |
| 1969 | Finland | 22 |
| 1971 | Australia | 23 |
| 1973 | New Zealand | 24 |
| 1994 | Mexico | 25 |
| 1995 | Czechia | 26 |
| 1996 | Hungary, Poland, South Korea | 29 |
| 2000 | Slovakia | 30 |
| 2010 | Chile, Estonia, Israel, Slovenia | 34 |
| 2016 | Latvia | 35 |
| 2018 | Lithuania | 36 |
| 2020 | Colombia | 37 |
| 2021 | Costa Rica | 38 |
OECD over time
Nominal GDP of the 6 largest economies
About these figures
- Combined figures are sums of the members’ own figures for one year, not official aggregates, and are shown only when every member has a figure for that year. Missing figures are not counted as zero.
- Growth, inflation and other rates are not added up or averaged into a group or continent rate, because an unweighted average gives a small economy the same weight as a large one.
- GDP is converted to US dollars at market exchange rates; GDP at purchasing power parity (PPP) adjusts for differences in price levels, so it is the better comparison of living standards and gives a different order.
- The tax column is central government tax revenue as the World Bank publishes it. It is not the OECD’s own tax-to-GDP ratio, which also counts social security contributions and taxes raised by state and local government, so it is lower, sometimes much lower, in federal countries. The Gini index comes from household surveys run in different years, shown in each cell.
- IMF figures for the current year are projections from the World Economic Outlook, revised at each release, not measured values.
Sources and definitions
- GDP IMF.NGDPD
- Economic output at current prices, expressed using market exchange rates. Unit: current US dollars. International Monetary Fund (World Economic Outlook)
- GDP per person IMF.NGDPDPC
- Current-price economic output divided by the population. Unit: current US dollars. International Monetary Fund (World Economic Outlook)
- GDP per person at PPP IMF.PPPPC
- Purchasing-power-adjusted current-price economic output per person. Unit: international dollars (PPP). International Monetary Fund (World Economic Outlook)
- Population SP.POP.TOTL
- Total population is based on the de facto definition of population, which counts all residents regardless of legal status or citizenship. The values shown are midyear estimates. Unit: people. World Bank (World Development Indicators)
- Real GDP growth IMF.NGDP_RPCH
- Annual growth in economic output after accounting for price changes. Unit: annual % change. International Monetary Fund (World Economic Outlook)
- Gini index SI.POV.GINI
- Gini index measures the extent to which the distribution of income (or, in some cases, consumption expenditure) among individuals or households within an economy deviates from a perfectly equal distribution. A Lorenz curve plots the cumulative percentages of total income received against the cumulative number of recipients, starting with the poorest individual or household. The Gini index measures the area between the Lorenz curve and a hypothetical line of absolute equality, expressed as a percentage of the maximum area under the line. Thus a Gini index of 0 represents perfect equality, while an index of 100 implies perfect inequality. Unit: 0 (equal) to 100. World Bank (World Development Indicators)
- Central government tax revenue GC.TAX.TOTL.GD.ZS
- Taxes are compulsory, unrequited payments, in cash or in kind, made by institutional units to government units. This indicator is expressed as a percentage of Gross Domestic Product (GDP) which is the total income earned through the production of goods and services in an economic territory during an accounting period. Unit: % of GDP (World Bank). World Bank (World Development Indicators)
Questions
How many OECD countries are there?
38: Australia, Austria, Belgium, Canada, Chile, Colombia, Costa Rica, Czechia, Denmark, Estonia, Finland, France, Germany, Greece, Hungary, Iceland, Ireland, Israel, Italy, Japan, Latvia, Lithuania, Luxembourg, Mexico, Netherlands, New Zealand, Norway, Poland, Portugal, Slovakia, Slovenia, South Korea, Spain, Sweden, Switzerland, Türkiye, United Kingdom and United States. Source: OECD: members and partners, checked October 21, 2026.
Which OECD country has the largest economy?
The United States, with nominal GDP of $32.64 trillion (2026 IMF projection, IMF World Economic Outlook). That is 41.8% of the members' combined GDP.
What is the richest OECD country?
By GDP per person, Luxembourg: $155,733 (2026 IMF projection). Luxembourg is also first at purchasing power parity ($156,638). GDP per person measures output, not household income or wealth.
Which country joined OECD most recently?
Costa Rica, in 2021. 19 countries have been members since 1961; the most recent to join was Costa Rica, in 2021.
How big is the combined OECD economy?
$78.03 trillion for 2026 (IMF projection), the sum of the 38 members' IMF figures, which is 61.5% of the total for the 189 economies SOTW covers. It is a SOTW sum, not an official aggregate.
How many people live in OECD countries?
1.40 billion people in 2025, the sum of the members' World Bank population estimates.