
NATO Countries: All 32 Members and Their Defense Spending
NATO has 32 members. Their combined nominal GDP is $63.38 trillion for 2026 (IMF projection), 50.0% of the $126.88 trillion total for the 189 economies SOTW covers. Together they had 984.1 million people in 2025, 12.0% of the world's population in SOTW's data. The United States has both the largest economy and the most people. Luxembourg has the highest GDP per person, $155,733 (2026 IMF projection). Of the 32 NATO members with a figure, 22 spent at least 2% of GDP on the military in 2025, on the SIPRI definition the World Bank publishes.
All 32 member countries. Germany joined as West Germany in 1955; each year is the one NATO gives for that accession. Source: NATO: member countries, checked October 21, 2026.
- Members
- 32
- Checked October 21, 2026
- Combined GDP
- $63.38T
- 2026 (IMF projection), 50.0% of covered world
- Population
- 984.1 million
- 2025, 12.0% of covered world
- At or above 2% of GDP
- 22
- of 32 with a military spending figure
Which NATO countries spend 2% of GDP on defense
Of the 32 NATO members with a figure, 22 spent at least 2% of GDP on the military in 2025, on the SIPRI definition the World Bank publishes. Poland spent the largest share, 4.50%; Luxembourg the smallest above zero, 0.85%. Iceland, which has no armed forces, is recorded at zero.
| # | Country | Military spending% of GDP (SIPRI) | Year | Military spending, US$current US dollars (SIPRI) | At least 2% |
|---|---|---|---|---|---|
| 1 | Poland | 4.50% | 2025 | $46.76B | Yes |
| 2 | Latvia | 3.61% | 2025 | $1.73B | Yes |
| 3 | Estonia | 3.37% | 2025 | $1.58B | Yes |
| 4 | Norway | 3.28% | 2025 | $17.03B | Yes |
| 5 | Denmark | 3.25% | 2025 | $14.95B | Yes |
| 6 | United States | 3.12% | 2025 | $954.39B | Yes |
| 7 | Lithuania | 3.08% | 2025 | $2.95B | Yes |
| 8 | Greece | 2.99% | 2025 | $8.39B | Yes |
| 9 | Finland | 2.57% | 2025 | $8.08B | Yes |
| 10 | Sweden | 2.47% | 2025 | $16.47B | Yes |
| 11 | United Kingdom | 2.35% | 2025 | $88.98B | Yes |
| 12 | Romania | 2.28% | 2025 | $9.73B | Yes |
| 13 | Germany | 2.27% | 2025 | $113.59B | Yes |
| 14 | Netherlands | 2.19% | 2025 | $28.94B | Yes |
| 15 | Spain | 2.13% | 2025 | $40.21B | Yes |
| 16 | Hungary | 2.04% | 2025 | $5.00B | Yes |
| 17 | Albania | 2.03% | 2025 | $623.6M | Yes |
| 18 | Slovakia | 2.03% | 2025 | $3.12B | Yes |
| 19 | France | 2.03% | 2025 | $68.01B | Yes |
| 20 | Croatia | 2.02% | 2025 | $2.10B | Yes |
| 21 | Belgium | 2.01% | 2025 | $14.53B | Yes |
| 22 | Bulgaria | 2.01% | 2025 | $2.59B | Yes |
| 23 | North Macedonia | 1.97% | 2025 | $374.8M | No |
| 24 | Türkiye | 1.91% | 2025 | $29.99B | No |
| 25 | Montenegro | 1.89% | 2025 | $176.5M | No |
| 26 | Italy | 1.89% | 2025 | $48.14B | No |
| 27 | Czechia | 1.84% | 2025 | $7.05B | No |
| 28 | Portugal | 1.71% | 2025 | $5.86B | No |
| 29 | Canada | 1.63% | 2025 | $37.49B | No |
| 30 | Slovenia | 1.54% | 2025 | $1.22B | No |
| 31 | Luxembourg | 0.85% | 2025 | $855.4M | No |
| 32 | Iceland | 0.00% | 2025 | $0 | No |
All 32 NATO members
Where the NATO members are
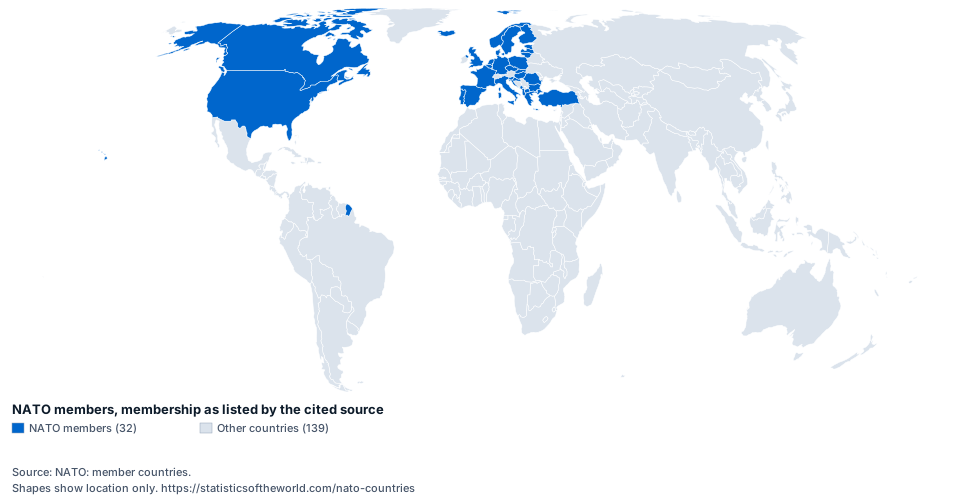
Embed this map
<a href="https://statisticsoftheworld.com/nato-countries"><img src="https://statisticsoftheworld.com/maps/group-nato.svg" width="960" height="500" alt="World map of the NATO members. Source: NATO: member countries."></a>
<p>Source: NATO: member countries. Map: <a href="https://statisticsoftheworld.com/nato-countries">Statistics of the World</a></p>
When each country joined NATO
Twelve countries have been members since 1949; the most recent to join was Sweden, in 2024. NATO has enlarged ten times since 1949.
| Year | Countries | Members after |
|---|---|---|
| 1949 | Belgium, Canada, Denmark, France, Iceland, Italy, Luxembourg, Netherlands, Norway, Portugal, United Kingdom, United States | 12 |
| 1952 | Greece, Türkiye | 14 |
| 1955 | Germany | 15 |
| 1982 | Spain | 16 |
| 1999 | Czechia, Hungary, Poland | 19 |
| 2004 | Bulgaria, Estonia, Latvia, Lithuania, Romania, Slovakia, Slovenia | 26 |
| 2009 | Albania, Croatia | 28 |
| 2017 | Montenegro | 29 |
| 2020 | North Macedonia | 30 |
| 2023 | Finland | 31 |
| 2024 | Sweden | 32 |
NATO over time
Nominal GDP of the 6 largest economies
About these figures
- Combined figures are sums of the members’ own figures for one year, not official aggregates, and are shown only when every member has a figure for that year. Missing figures are not counted as zero.
- Growth, inflation and other rates are not added up or averaged into a group or continent rate, because an unweighted average gives a small economy the same weight as a large one.
- GDP is converted to US dollars at market exchange rates; GDP at purchasing power parity (PPP) adjusts for differences in price levels, so it is the better comparison of living standards and gives a different order.
- Military spending here is SIPRI’s measure as published by the World Bank. NATO publishes its own defence expenditure estimates, which use a different definition, so a country can be above 2% in one and below it in the other. NATO members pledged in 2014 to move towards 2% of GDP within a decade, and agreed at The Hague in 2025 to reach 5% of GDP by 2035, of which at least 3.5% is core defence.
- IMF figures for the current year are projections from the World Economic Outlook, revised at each release, not measured values.
Sources and definitions
- Military spending MS.MIL.XPND.GD.ZS
- Military expenditure by country as percentage of gross domestic product Unit: % of GDP (SIPRI). World Bank (World Development Indicators)
- Military spending, US$ MS.MIL.XPND.CD
- Military spending USD, in current prices (converted at the exchange rate for the given year) Unit: current US dollars (SIPRI). World Bank (World Development Indicators)
- GDP IMF.NGDPD
- Economic output at current prices, expressed using market exchange rates. Unit: current US dollars. International Monetary Fund (World Economic Outlook)
- GDP per person IMF.NGDPDPC
- Current-price economic output divided by the population. Unit: current US dollars. International Monetary Fund (World Economic Outlook)
- Population SP.POP.TOTL
- Total population is based on the de facto definition of population, which counts all residents regardless of legal status or citizenship. The values shown are midyear estimates. Unit: people. World Bank (World Development Indicators)
- GDP per person at PPP IMF.PPPPC
- Purchasing-power-adjusted current-price economic output per person. Unit: international dollars (PPP). International Monetary Fund (World Economic Outlook)
Questions
How many NATO countries are there?
32: Albania, Belgium, Bulgaria, Canada, Croatia, Czechia, Denmark, Estonia, Finland, France, Germany, Greece, Hungary, Iceland, Italy, Latvia, Lithuania, Luxembourg, Montenegro, Netherlands, North Macedonia, Norway, Poland, Portugal, Romania, Slovakia, Slovenia, Spain, Sweden, Türkiye, United Kingdom and United States. Source: NATO: member countries, checked October 21, 2026.
Which NATO country has the largest economy?
The United States, with nominal GDP of $32.64 trillion (2026 IMF projection, IMF World Economic Outlook). That is 51.5% of the members' combined GDP.
What is the richest NATO country?
By GDP per person, Luxembourg: $155,733 (2026 IMF projection). Luxembourg is also first at purchasing power parity ($156,638). GDP per person measures output, not household income or wealth.
Which NATO countries spend 2% of GDP on defense?
22 of the 32 members with a figure: Poland, Latvia, Estonia, Norway, Denmark, United States, Lithuania, Greece, Finland, Sweden, United Kingdom, Romania, Germany, Netherlands, Spain, Hungary, Albania, Slovakia, France, Croatia, Belgium and Bulgaria. Poland spent the largest share, 4.50%; Luxembourg the smallest above zero, 0.85%. Iceland, which has no armed forces, is recorded at zero. Figures are SIPRI's, published by the World Bank; NATO's own estimates differ.
Which country joined NATO most recently?
Sweden, in 2024. Twelve countries have been members since 1949; the most recent to join was Sweden, in 2024.
How big is the combined NATO economy?
$63.38 trillion for 2026 (IMF projection), the sum of the 32 members' IMF figures, which is 50.0% of the total for the 189 economies SOTW covers. It is a SOTW sum, not an official aggregate.
How many people live in NATO countries?
984.1 million people in 2025, the sum of the members' World Bank population estimates.