
Commonwealth Countries: All 56 Members
The Commonwealth has 56 members. Their combined nominal GDP is $17.38 trillion for 2026 (IMF projection), 13.7% of the $126.88 trillion total for the 189 economies SOTW covers. Together they had 2.80 billion people in 2025, 34.2% of the world's population in SOTW's data. The United Kingdom has the largest economy and India the most people. Singapore has the highest GDP per person, $109,117 (2026 IMF projection).
All 56 member countries, in the five regions the Commonwealth Secretariat uses. Source: Commonwealth Secretariat: member countries, checked October 21, 2026.
- Members
- 56
- Checked October 21, 2026
- Combined GDP
- $17.38T
- 2026 (IMF projection), 13.7% of covered world
- Population
- 2.80 billion
- 2025, 34.2% of covered world
- Highest GDP per person
- Singapore
- $109,117, 2026 (IMF projection)
All 56 Commonwealth members
Where the Commonwealth members are
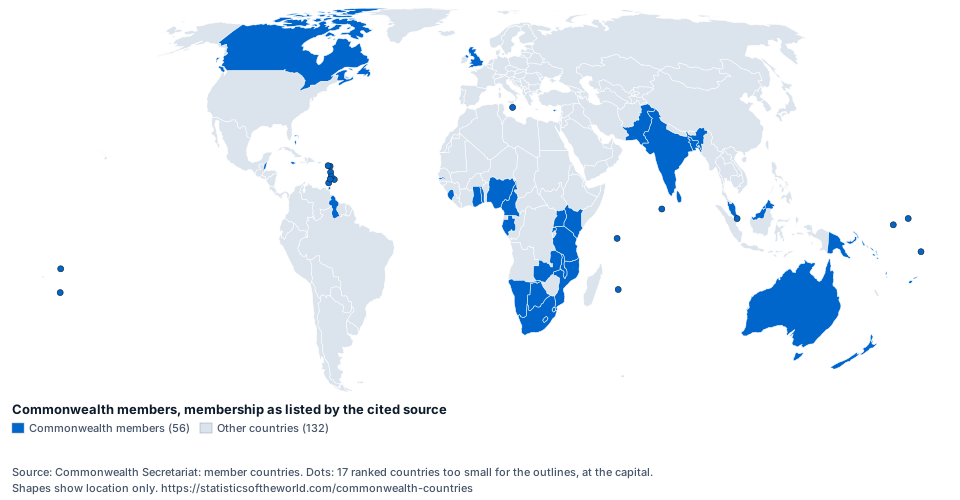
Embed this map
<a href="https://statisticsoftheworld.com/commonwealth-countries"><img src="https://statisticsoftheworld.com/maps/group-commonwealth.svg" width="960" height="500" alt="World map of the Commonwealth members. Source: Commonwealth Secretariat: member countries."></a>
<p>Source: Commonwealth Secretariat: member countries. Map: <a href="https://statisticsoftheworld.com/commonwealth-countries">Statistics of the World</a></p>
Commonwealth members by region
Asia has the most people of these regions: 1.96 billion people in 2025.
| Region | Economies | Population, 2025 | GDP, 2026 IMF projection | Most populous |
|---|---|---|---|---|
| Africa | 21 | 674.5 million | $1.61T | Nigeria |
| Asia | 8 | 1.96 billion | $6.37T | India |
| Caribbean and Americas | 13 | 48.4 million | $2.62T | Canada |
| Europe | 3 | 71.4 million | $4.34T | United Kingdom |
| Pacific | 11 | 46.3 million | $2.43T | Australia |
Largest Commonwealth economies
The United Kingdom has the highest nominal GDP among the Commonwealth members: $4.27T (2026 IMF projection). The ten listed account for 91.9% of the members' combined nominal GDP.
| # | Country | GDPcurrent US dollars | Year |
|---|---|---|---|
| 1 | United Kingdom | $4.27T | 2026 (IMF projection) |
| 2 | India | $4.06T | 2026 (IMF projection) |
| 3 | Canada | $2.49T | 2026 (IMF projection) |
| 4 | Australia | $2.11T | 2026 (IMF projection) |
| 5 | Singapore | $667.89B | 2026 (IMF projection) |
| 6 | Malaysia | $547.10B | 2026 (IMF projection) |
| 7 | Bangladesh | $506.36B | 2026 (IMF projection) |
| 8 | South Africa | $489.08B | 2026 (IMF projection) |
| 9 | Pakistan | $450.13B | 2026 (IMF projection) |
| 10 | Nigeria | $386.67B | 2026 (IMF projection) |
Richest Commonwealth countries by GDP per person
Singapore has the highest GDP per person among the Commonwealth members: $109,117 (2026 IMF projection). Singapore is also highest at purchasing power parity, which adjusts for price levels ($176,927).
| # | Country | GDP per personcurrent US dollars | Year | GDP per person at PPPinternational dollars (PPP) |
|---|---|---|---|---|
| 1 | Singapore | $109,117 | 2026 (IMF projection) | $176,927rank 1 |
| 2 | Australia | $75,172 | 2026 (IMF projection) | $75,039rank 5 |
| 3 | United Kingdom | $61,108 | 2026 (IMF projection) | $68,476rank 7 |
| 4 | Canada | $60,105 | 2026 (IMF projection) | $70,374rank 6 |
| 5 | Malta | $52,149 | 2026 (IMF projection) | $80,020rank 4 |
| 6 | New Zealand | $51,043 | 2026 (IMF projection) | $58,563rank 9 |
| 7 | Cyprus | $44,477 | 2026 (IMF projection) | $68,256rank 8 |
| 8 | Bahamas | $43,858 | 2026 (IMF projection) | $47,248rank 11 |
| 9 | Brunei | $40,613 | 2026 (IMF projection) | $98,028rank 3 |
| 10 | Guyana | $38,572 | 2026 (IMF projection) | $98,912rank 2 |
Commonwealth over time
Nominal GDP of the 6 largest economies
About these figures
- Combined figures are sums of the members’ own figures for one year, not official aggregates, and are shown only when every member has a figure for that year. Missing figures are not counted as zero.
- Growth, inflation and other rates are not added up or averaged into a group or continent rate, because an unweighted average gives a small economy the same weight as a large one.
- GDP is converted to US dollars at market exchange rates; GDP at purchasing power parity (PPP) adjusts for differences in price levels, so it is the better comparison of living standards and gives a different order.
- The Commonwealth Secretariat does not publish the year each member joined on its member list, so no join year is shown.
- IMF figures for the current year are projections from the World Economic Outlook, revised at each release, not measured values.
Sources and definitions
- Population SP.POP.TOTL
- Total population is based on the de facto definition of population, which counts all residents regardless of legal status or citizenship. The values shown are midyear estimates. Unit: people. World Bank (World Development Indicators)
- GDP IMF.NGDPD
- Economic output at current prices, expressed using market exchange rates. Unit: current US dollars. International Monetary Fund (World Economic Outlook)
- GDP per person IMF.NGDPDPC
- Current-price economic output divided by the population. Unit: current US dollars. International Monetary Fund (World Economic Outlook)
- GDP per person at PPP IMF.PPPPC
- Purchasing-power-adjusted current-price economic output per person. Unit: international dollars (PPP). International Monetary Fund (World Economic Outlook)
- Real GDP growth IMF.NGDP_RPCH
- Annual growth in economic output after accounting for price changes. Unit: annual % change. International Monetary Fund (World Economic Outlook)
Questions
How many Commonwealth countries are there?
56: Antigua and Barbuda, Australia, Bahamas, Bangladesh, Barbados, Belize, Botswana, Brunei, Cameroon, Canada, Cyprus, Dominica, Eswatini, Fiji, Gabon, Ghana, Grenada, Guyana, India, Jamaica, Kenya, Kiribati, Lesotho, Malawi, Malaysia, Maldives, Malta, Mauritius, Mozambique, Namibia, Nauru, New Zealand, Nigeria, Pakistan, Papua New Guinea, Rwanda, Samoa, Seychelles, Sierra Leone, Singapore, Solomon Islands, South Africa, Sri Lanka, St. Kitts and Nevis, St. Lucia, St. Vincent and the Grenadines, Tanzania, The Gambia, Togo, Tonga, Trinidad and Tobago, Tuvalu, Uganda, United Kingdom, Vanuatu and Zambia. Source: Commonwealth Secretariat: member countries, checked October 21, 2026.
Which Commonwealth country has the largest economy?
The United Kingdom, with nominal GDP of $4.27 trillion (2026 IMF projection, IMF World Economic Outlook). That is 24.6% of the members' combined GDP.
What is the richest Commonwealth country?
By GDP per person, Singapore: $109,117 (2026 IMF projection). Singapore is also first at purchasing power parity ($176,927). GDP per person measures output, not household income or wealth.
How big is the combined Commonwealth economy?
$17.38 trillion for 2026 (IMF projection), the sum of the 56 members' IMF figures, which is 13.7% of the total for the 189 economies SOTW covers. It is a SOTW sum, not an official aggregate.
How many people live in Commonwealth countries?
2.80 billion people in 2025, the sum of the members' World Bank population estimates.