
Current Account Balance by Country: 2026 World Rankings
Current account balance as percentage of GDP. Positive = surplus, negative = deficit.
Macao has the highest current account balance as a share of GDP: 39.8% in 2026 (IMF projection). Next are Guyana (31.6%), Brunei (23.7%), Norway (20.7%) and Andorra (20.5%). Suriname has the lowest current account balance as a share of GDP: -51.0% in 2026 (IMF projection). The median across the 191 countries is -1.9%, counting each country once, so it is not a world average.
Source: IMF World Economic Outlook, October 2026 edition. 191 of 217 countries and territories have a figure. 188 of 191 countries show 2026 (IMF projections); the other 3 show their latest available year (2025).
- Highest
- 39.8%
- Macao, 2026 (IMF projection)
- Lowest
- -51.0%
- Suriname, 2026 (IMF projection)
- Median
- -1.9%
- Counting each country once, so it is not a world average; includes IMF projections
- Coverage
- 191 of 217
- Countries and territories with a figure; mostly 2026 IMF projections
| # | Country | Current Account Balance (% of GDP) | Year | Change since 2016 to the 2026 IMF projection (pp) |
|---|---|---|---|---|
| 1 | Macao | 39.8% | 2026projection | +13.7 pp |
| 2 | Guyana | 31.6% | 2026projection | +30.1 pp |
| 3 | Brunei | 23.7% | 2026projection | +10.8 pp |
| 4 | Norway | 20.7% | 2026projection | +15.4 pp |
| 5 | Andorra | 20.5% | 2026projection | n/a |
| 6 | South Korea | 18.8% | 2026projection | +12.6 pp |
| 7 | Kuwait | 18.3% | 2026projection | +22.9 pp |
| 8 | San Marino | 17.0% | 2026projection | n/a |
| 9 | Singapore | 16.7% | 2026projection | -1.3 pp |
| 10 | Liechtenstein | 16.6% | 2026projection | -13.5 pp |
| 11 | Papua New Guinea | 14.1% | 2026projection | +0.5 pp |
| 12 | Nepal | 13.9% | 2026projection | +8.4 pp |
| 13 | Hong Kong | 13.8% | 2026projection | +9.8 pp |
| 14 | Djibouti | 11.5% | 2026projection | +12.5 pp |
| 15 | Azerbaijan | 11.3% | 2026projection | +14.9 pp |
| 16 | Denmark | 11.2% | 2026projection | +4.1 pp |
| 17 | Marshall Islands | 10.7% | 2026projection | -5.5 pp |
| 18 | Aruba | 10.5% | 2026projection | +5.9 pp |
| 19 | Netherlands | 8.3% | 2026projection | +1.1 pp |
| 20 | South Sudan | 8.2% | 2026projection | +15.8 pp |
| 20 | Tajikistan | 8.2% | 2026projection | +13.4 pp |
| 22 | Ireland | 7.4% | 2026projection | +8.6 pp |
| 23 | Sweden | 7.3% | 2026projection | +5.3 pp |
| 24 | Qatar | 7.1% | 2026projection | +12.6 pp |
| 25 | Nigeria | 7.0% | 2026projection | +6.1 pp |
| 26 | Malta | 6.5% | 2026projection | +7.1 pp |
| 27 | Nicaragua | 6.4% | 2026projection | +14.9 pp |
| 28 | Switzerland | 6.2% | 2026projection | -0.9 pp |
| 29 | Ghana | 6.0% | 2026projection | +11.1 pp |
| 30 | Samoa | 5.6% | 2026projection | +9.8 pp |
| 30 | Trinidad and Tobago | 5.6% | 2026projection | +8.9 pp |
| 32 | Zimbabwe | 5.3% | 2026projection | +7.7 pp |
| 33 | Republic of the Congo | 5.2% | 2026projection | +50.5 pp |
| 34 | Laos | 5.1% | 2026projection | +13.8 pp |
| 35 | Oman | 5.0% | 2026projection | +21.6 pp |
| 36 | United Arab Emirates | 4.8% | 2026projection | +1.3 pp |
| 37 | Tuvalu | 4.7% | 2026projection | -25.2 pp |
| 38 | Ecuador | 4.6% | 2026projection | +3.7 pp |
| 38 | Japan | 4.6% | 2026projection | +0.7 pp |
| 40 | Germany | 4.5% | 2026projection | -4.4 pp |
| 41 | Luxembourg | 4.2% | 2026projection | -3.2 pp |
| 42 | China | 4.0% | 2026projection | +2.3 pp |
| 42 | Peru | 4.0% | 2026projection | +6.3 pp |
| 44 | Russia | 3.8% | 2026projection | +1.9 pp |
| 45 | Bahrain | 3.6% | 2026projection | +8.0 pp |
| 45 | Guatemala | 3.6% | 2026projection | +2.6 pp |
| 47 | Slovenia | 2.9% | 2026projection | -2.4 pp |
| 48 | Angola | 2.8% | 2026projection | +5.4 pp |
| 49 | Spain | 2.6% | 2026projection | -0.5 pp |
| 50 | Zambia | 2.3% | 2026projection | +5.6 pp |
| 51 | Nauru | 2.2% | 2026projection | -2.0 pp |
| 52 | Malaysia | 2.1% | 2026projection | -0.3 pp |
| 53 | Eswatini | 1.8% | 2026projection | -6.3 pp |
| 54 | Bolivia | 1.6% | 2026projection | +6.2 pp |
| 55 | Austria | 1.4% | 2026projection | -1.2 pp |
| 55 | Turkmenistan | 1.4% | 2026projection | +28.2 pp |
| 57 | Chad | 1.3% | 2026projection | +5.4 pp |
| 57 | Gabon | 1.3% | 2026projection | +6.7 pp |
| 57 | Haiti | 1.3% | 2026projection | +3.0 pp |
| 60 | Israel | 1.1% | 2026projection | -2.1 pp |
| 61 | Libya | 0.9% | 2026projection | +10.3 pp |
| 62 | Italy | 0.7% | 2026projection | -1.8 pp |
| 63 | Argentina | 0.6% | 2026projection | +3.3 pp |
| 64 | Kazakhstan | 0.5% | 2026projection | +5.6 pp |
| 65 | Finland | 0.3% | 2026projection | +2.3 pp |
| 65 | Vietnam | 0.3% | 2026projection | +0.1 pp |
| 67 | Micronesia | 0.0% | 2026projection | -13.6 pp |
| 67 | Pakistan | 0.0% | 2026projection | +1.6 pp |
| 67 | Portugal | 0.0% | 2026projection | -1.4 pp |
| 70 | Canada | -0.1% | 2026projection | +3.0 pp |
| 70 | Equatorial Guinea | -0.1% | 2026projection | +25.9 pp |
| 72 | Bangladesh | -0.3% | 2026projection | -1.9 pp |
| 72 | Chile | -0.3% | 2026projection | +2.3 pp |
| 72 | Mexico | -0.3% | 2026projection | +2.0 pp |
| 75 | Hungary | -0.5% | 2026projection | -4.9 pp |
| 75 | Sri Lanka | -0.5% | 2026projection | +1.5 pp |
| 77 | Burkina Faso | -0.6% | 2026projection | +5.5 pp |
| 78 | France | -0.7% | 2026projection | -0.2 pp |
| 78 | South Africa | -0.7% | 2026projection | +2.0 pp |
| 80 | Algeria | -0.8% | 2026projection | +13.8 pp |
| 80 | Myanmar | -0.8% | 2026projection | +4.3 pp |
| 82 | Uruguay | -0.9% | 2026projection | -1.7 pp |
| 83 | Botswana | -1.0% | 2026projection | -9.0 pp |
| 83 | Venezuela | -1.0% | 2026projection | +2.1 pp |
| 85 | Iran | -1.2% | 2026projection | -4.0 pp |
| 85 | Senegal | -1.2% | 2025 | +3.0 pp2016 to 2025 |
| 85 | Thailand | -1.2% | 2026projection | -11.7 pp |
| 88 | Costa Rica | -1.5% | 2026projection | +0.6 pp |
| 88 | Dominican Republic | -1.5% | 2026projection | -0.4 pp |
| 88 | India | -1.5% | 2026projection | -0.9 pp |
| 88 | Panama | -1.5% | 2026projection | +6.0 pp |
| 92 | Indonesia | -1.6% | 2026projection | +0.2 pp |
| 93 | Cabo Verde | -1.9% | 2026projection | +1.5 pp |
| 93 | Czechia | -1.9% | 2026projection | -3.7 pp |
| 93 | DR Congo | -1.9% | 2026projection | +2.0 pp |
| 93 | Poland | -1.9% | 2026projection | -0.8 pp |
| 97 | Honduras | -2.0% | 2026projection | +1.1 pp |
| 98 | Albania | -2.1% | 2026projection | +5.3 pp |
| 99 | Mongolia | -2.2% | 2026projection | +4.1 pp |
| 100 | Lithuania | -2.3% | 2026projection | -1.3 pp |
| 101 | Brazil | -2.4% | 2026projection | -0.7 pp |
| 101 | Côte d'Ivoire | -2.4% | 2026projection | -1.5 pp |
| 103 | Estonia | -2.5% | 2026projection | -3.5 pp |
| 103 | Ethiopia | -2.5% | 2026projection | +8.1 pp |
| 103 | Iceland | -2.5% | 2026projection | -11.4 pp |
| 103 | Lesotho | -2.5% | 2026projection | +9.4 pp |
| 107 | Colombia | -2.6% | 2026projection | +1.9 pp |
| 108 | Tanzania | -2.7% | 2026projection | +1.5 pp |
| 109 | Belgium | -2.8% | 2026projection | -3.4 pp |
| 109 | Paraguay | -2.8% | 2026projection | -7.4 pp |
| 111 | Türkiye | -2.9% | 2026projection | -0.4 pp |
| 112 | Niger | -3.0% | 2026projection | +8.4 pp |
| 113 | Australia | -3.1% | 2026projection | +0.3 pp |
| 114 | Belarus | -3.2% | 2026projection | +0.2 pp |
| 114 | Solomon Islands | -3.2% | 2026projection | +0.5 pp |
| 116 | Central African Republic | -3.3% | 2026projection | -3.0 pp |
| 116 | United Kingdom | -3.3% | 2026projection | +1.8 pp |
| 116 | Yemen | -3.3% | 2026projection | +22.4 pp |
| 119 | Mali | -3.4% | 2026projection | +2.7 pp |
| 119 | New Zealand | -3.4% | 2026projection | -1.3 pp |
| 119 | Slovakia | -3.4% | 2026projection | -1.9 pp |
| 122 | Georgia | -3.5% | 2026projection | +8.7 pp |
| 122 | Saudi Arabia | -3.5% | 2026projection | +0.4 pp |
| 124 | United States | -3.9% | 2026projection | -1.9 pp |
| 125 | Croatia | -4.4% | 2026projection | -6.5 pp |
| 125 | Egypt | -4.4% | 2026projection | +1.2 pp |
| 127 | Kenya | -4.5% | 2026projection | -0.4 pp |
| 128 | Serbia | -4.6% | 2026projection | -1.8 pp |
| 129 | Sierra Leone | -4.7% | 2026projection | +0.2 pp |
| 130 | Cameroon | -4.8% | 2026projection | -1.7 pp |
| 130 | El Salvador | -4.8% | 2026projection | -2.5 pp |
| 130 | Philippines | -4.8% | 2026projection | -4.4 pp |
| 130 | Togo | -4.8% | 2026projection | +2.4 pp |
| 134 | Bosnia and Herzegovina | -4.9% | 2026projection | -0.2 pp |
| 134 | Morocco | -4.9% | 2026projection | -1.1 pp |
| 134 | Tunisia | -4.9% | 2026projection | +4.8 pp |
| 137 | Jamaica | -5.1% | 2026projection | -4.8 pp |
| 137 | Uzbekistan | -5.1% | 2026projection | -5.3 pp |
| 139 | Belize | -5.2% | 2026projection | +2.1 pp |
| 140 | Benin | -5.6% | 2026projection | -2.6 pp |
| 141 | North Macedonia | -5.8% | 2026projection | -3.2 pp |
| 141 | St. Lucia | -5.8% | 2026projection | +0.5 pp |
| 143 | Latvia | -5.9% | 2026projection | -7.7 pp |
| 143 | The Gambia | -5.9% | 2026projection | +3.3 pp |
| 145 | Comoros | -6.1% | 2026projection | -1.7 pp |
| 145 | Sao Tome and Principe | -6.1% | 2026projection | +0.3 pp |
| 147 | Barbados | -6.3% | 2026projection | -2.7 pp |
| 147 | Vanuatu | -6.3% | 2026projection | +1.2 pp |
| 149 | Greece | -6.6% | 2026projection | -4.2 pp |
| 150 | Burundi | -6.8% | 2026projection | +4.3 pp |
| 151 | Guinea-Bissau | -7.0% | 2026projection | -8.4 pp |
| 151 | Romania | -7.0% | 2026projection | -4.9 pp |
| 153 | Tonga | -7.2% | 2026projection | +1.1 pp |
| 154 | Uganda | -7.3% | 2026projection | -4.7 pp |
| 155 | Jordan | -7.5% | 2026projection | -2.2 pp |
| 156 | Cyprus | -7.7% | 2026projection | -3.7 pp |
| 157 | Mauritania | -7.8% | 2026projection | +3.2 pp |
| 158 | Mauritius | -7.9% | 2026projection | -4.0 pp |
| 159 | Bulgaria | -8.0% | 2026projection | -11.0 pp |
| 160 | Armenia | -8.2% | 2026projection | -7.2 pp |
| 161 | Seychelles | -8.5% | 2026projection | -5.6 pp |
| 162 | Cambodia | -8.7% | 2026projection | -1.8 pp |
| 162 | Madagascar | -8.7% | 2026projection | -9.2 pp |
| 164 | Kyrgyzstan | -9.0% | 2026projection | +2.6 pp |
| 165 | Bahamas | -9.3% | 2026projection | +3.1 pp |
| 166 | Rwanda | -10.5% | 2026projection | +5.0 pp |
| 167 | Guinea | -10.7% | 2026projection | +9.0 pp |
| 168 | Iraq | -10.8% | 2026projection | -3.9 pp |
| 169 | Ukraine | -11.0% | 2026projection | -9.0 pp |
| 170 | Malawi | -12.2% | 2026projection | +0.9 pp |
| 171 | Antigua and Barbuda | -12.7% | 2026projection | -10.3 pp |
| 172 | Fiji | -12.9% | 2026projection | -9.4 pp |
| 173 | Palau | -13.8% | 2026projection | +2.2 pp |
| 174 | Sudan | -14.6% | 2026projection | -8.1 pp |
| 175 | Kiribati | -16.1% | 2026projection | -25.4 pp |
| 176 | St. Kitts and Nevis | -16.2% | 2026projection | -4.1 pp |
| 177 | Bhutan | -16.3% | 2026projection | +12.7 pp |
| 178 | Namibia | -16.9% | 2026projection | -0.4 pp |
| 179 | St. Vincent and the Grenadines | -17.2% | 2026projection | -4.1 pp |
| 180 | Maldives | -18.6% | 2026projection | +4.9 pp |
| 181 | Montenegro | -19.7% | 2026projection | -3.4 pp |
| 182 | Liberia | -19.9% | 2026projection | +1.8 pp |
| 183 | Moldova | -22.0% | 2026projection | -18.4 pp |
| 184 | Lebanon | -22.5% | 2025 | -1.8 pp2016 to 2025 |
| 185 | Grenada | -22.8% | 2026projection | -14.0 pp |
| 186 | Somalia | -25.4% | 2026projection | -19.9 pp |
| 187 | Dominica | -35.7% | 2026projection | -26.7 pp |
| 188 | Afghanistan | -37.9% | 2025 | -46.9 pp2016 to 2025 |
| 189 | Timor-Leste | -38.5% | 2026projection | -5.3 pp |
| 190 | Mozambique | -41.0% | 2026projection | -9.1 pp |
| 191 | Suriname | -51.0% | 2026projection | -46.2 pp |
Rows can refer to different years, and IMF figures for a year that has not ended are projections; compare years before comparing values. n/a means the source has no figure for that country in that column. Values are rounded for display; the CSV download has full precision.
Economies without an IMF figure
These have a figure from another publisher. They are not ranked, summed or counted above, because a different source measures differently.
- Bermuda: 18.3% (World Bank, 2024)
- Cayman Islands: -8.8% (World Bank, 2024)
- Curaçao: -20.0% (World Bank, 2023)
- Kosovo: -8.1% (World Bank, 2025)
- Sint Maarten: -6.9% (World Bank, 2023)
- West Bank and Gaza: -15.8% (World Bank, 2025)
No figure: American Samoa, British Virgin Islands, Channel Islands, Cuba, Eritrea, Faroe Islands, French Polynesia, Gibraltar, Greenland, Guam, Isle of Man, Monaco, New Caledonia, North Korea, Northern Mariana Islands, Puerto Rico, Saint Martin, Syria, Turks and Caicos Islands, U.S. Virgin Islands.
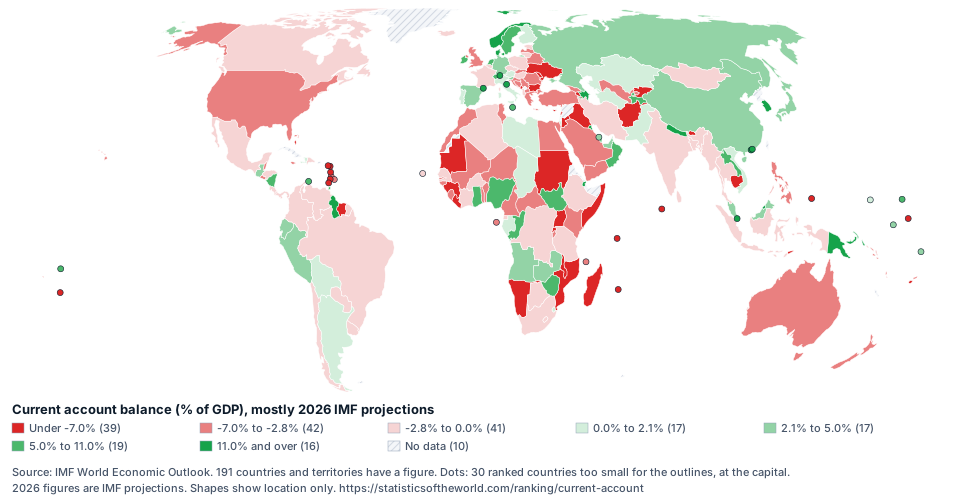
Embed this map
<a href="https://statisticsoftheworld.com/ranking/current-account"><img src="https://statisticsoftheworld.com/maps/IMF.BCA_NGDPD.svg" width="960" height="500" alt="World map of current account balance as a share of GDP, mostly 2026 IMF projections. Source: IMF World Economic Outlook."></a>
<p>Source: IMF World Economic Outlook. Map: <a href="https://statisticsoftheworld.com/ranking/current-account">Statistics of the World</a></p>
Then and now
| # | 2000 | 2016 | 2026 (IMF projection) |
|---|---|---|---|
| 1 | Brunei (45.1%) | Liechtenstein (30.1%) | Macao (39.8%) |
| 2 | Kuwait (38.9%) | Tuvalu (29.9%) | Guyana (31.6%) |
| 3 | Djibouti (19.6%) | Macao (26.1%) | Brunei (23.7%) |
| 4 | Gabon (18.5%) | Singapore (18.0%) | Norway (20.7%) |
| 5 | Republic of the Congo (17.5%) | Marshall Islands (16.2%) | Andorra (20.5%) |
| 6 | Russia (16.3%) | Micronesia (13.6%) | South Korea (18.8%) |
| 7 | United Arab Emirates (16.3%) | Papua New Guinea (13.6%) | Kuwait (18.3%) |
| 8 | Algeria (15.4%) | Eritrea (13.4%) | San Marino (17.0%) |
| 9 | Norway (14.5%) | Brunei (12.9%) | Singapore (16.7%) |
| 10 | Oman (14.1%) | Thailand (10.5%) | Liechtenstein (16.6%) |
The Republic of the Congo rose the most since 2016, +50.5 pp, among the 186 countries with figures for both 2016 and 2026; the 2026 figures are IMF projections. Suriname fell the most, -46.2 pp, to the 2026 IMF projection.
Rose the most from 2016 to the 2026 IMF projection
- Republic of the Congo: +50.5 pp
- Guyana: +30.1 pp
- Turkmenistan: +28.2 pp
- Equatorial Guinea: +25.9 pp
- Kuwait: +22.9 pp
Fell the most from 2016 to the 2026 IMF projection
- Suriname: -46.2 pp
- Dominica: -26.7 pp
- Kiribati: -25.4 pp
- Tuvalu: -25.2 pp
- Somalia: -19.9 pp
From the change column: countries whose latest figure is for 2026 and that have a 2016 figure. The 2026 figures are IMF projections, not measured values.
What the October 2026 edition changed
Compared with the April 2026 edition, the October 2026 IMF World Economic Outlook raised the 2026 figure for 87 economies, cut it for 96 and left 4 unchanged, among the 187 economies with a value in both. Values are compared at the precision both editions were stored with.
Largest increases
- South Korea: 5.6% to 18.8% (+13.2 pp)
- Republic of the Congo: -6% to 5.2% (+11.2 pp)
- Guyana: 21.5% to 31.6% (+10.1 pp)
- Brunei: 14.5% to 23.7% (+9.2 pp)
- Marshall Islands: 2.4% to 10.7% (+8.3 pp)
Largest cuts
- Somalia: -8.7% to -25.4% (-16.7 pp)
- Sudan: -4.5% to -14.6% (-10.1 pp)
- Burkina Faso: 8.6% to -0.6% (-9.2 pp)
- Venezuela: 7.1% to -1% (-8.1 pp)
- Liberia: -12% to -19.9% (-7.9 pp)
By region
| Region | Countries | Highest | Lowest | Median, each country counted once |
|---|---|---|---|---|
| East Asia & Pacific | 31 | Macao (39.8%) | Timor-Leste (-38.5%) | 0.0% |
| Europe & Central Asia | 51 | Norway (20.7%) | Moldova (-22.0%) | -1.9% |
| Latin America & Caribbean | 33 | Guyana (31.6%) | Suriname (-51.0%) | -1.5% |
| Middle East, North Africa, Afghanistan & Pakistan | 21 | Kuwait (18.3%) | Afghanistan (-37.9%, 2025) | -0.8% |
| North America | 2 | Canada (-0.1%) | United States (-3.9%) | -2.0% |
| South Asia | 6 | Nepal (13.9%) | Maldives (-18.6%) | -1.0% |
| Sub-Saharan Africa | 47 | South Sudan (8.2%) | Mozambique (-41.0%) | -3.4% |
The 2026 figures are IMF projections, not measured values.
Where major economies rank
- United States: -3.9% in 2026 (IMF projection), rank 124 of 191.
- China: 4.0% in 2026 (IMF projection), rank 42 of 191.
- India: -1.5% in 2026 (IMF projection), rank 88 of 191.
- Japan: 4.6% in 2026 (IMF projection), rank 38 of 191.
- Germany: 4.5% in 2026 (IMF projection), rank 40 of 191.
- United Kingdom: -3.3% in 2026 (IMF projection), rank 116 of 191.
- France: -0.7% in 2026 (IMF projection), rank 78 of 191.
- Brazil: -2.4% in 2026 (IMF projection), rank 101 of 191.
- Canada: -0.1% in 2026 (IMF projection), rank 70 of 191.
- Nigeria: 7.0% in 2026 (IMF projection), rank 25 of 191.
Understanding Current Account Balance by Country
The current account balance measures the net flow of goods, services, income and transfers between a country and the rest of the world, expressed as a percentage of GDP. A surplus means a country earns more from abroad than it spends there; a deficit means the reverse. The data comes from the IMF World Economic Outlook.
Germany, China, Japan and the oil-exporting Gulf states have long run current account surpluses. The United States runs the world's largest deficit in dollar terms and finances the gap by selling financial assets to foreign investors.
Whether a deficit is a problem depends on context. The US deficit is sustainable largely because the dollar is the world's reserve currency. For emerging markets, persistent deficits financed by short-term foreign borrowing can become dangerous, as in the dynamic behind the 1997 Asian financial crisis. Persistent imbalances of more than a few percent of GDP, in either direction, are often treated as a warning sign worth investigating.
About these figures
Definition. Current-account balance relative to GDP. (The publisher's definition of “Current account balance, percent of GDP”, copied from the International Monetary Fund (World Economic Outlook) on 2026-09-07.)
Unit. percent of GDP
Coverage. 191 of 217 countries and territories have a figure. 188 of 191 countries show 2026 (IMF projections); the other 3 show their latest available year (2025).
IMF projection: a forecast from the IMF World Economic Outlook, revised at each release, not a measured value.
The median and any other summary on this page count each country once, so they are not world averages. Values are rounded for display; the CSV download has full precision.
The IMF publishes the World Economic Outlook in April and October and can revise past years in each edition.
Questions about these figures
Which country has the highest current account balance as a share of GDP?
Macao has the highest current account balance as a share of GDP: 39.8% in 2026 (IMF projection). The figures come from the IMF World Economic Outlook.
Which country has the lowest current account balance as a share of GDP?
Suriname has the lowest current account balance as a share of GDP: -51.0% in 2026 (IMF projection).
How many countries are ranked, and for which years?
191 countries and territories have a figure in this ranking. 188 of 191 countries show 2026 (IMF projections); the other 3 show their latest available year (2025).
What is the median current account balance as a share of GDP across countries?
The median is -1.9%: half of the 191 countries are above it and half below. The most common year of the figures is 2026, an IMF projection year. It counts each country once, so it is not a world average.
Which country's current account balance as a share of GDP changed the most since 2016?
Among the 186 countries with figures for both 2016 and 2026, the Republic of the Congo changed the most: +50.5 pp since 2016, to 5.2% in 2026 (IMF projection).
Where does the United States rank on current account balance as a share of GDP?
The United States ranks 124 of 191, at -3.9% in 2026 (IMF projection).
Which country has the highest current account balance as a share of GDP in each region?
East Asia & Pacific: Macao (39.8%); Europe & Central Asia: Norway (20.7%); Latin America & Caribbean: Guyana (31.6%); Middle East, North Africa, Afghanistan & Pakistan: Kuwait (18.3%); North America: Canada (-0.1%); South Asia: Nepal (13.9%); Sub-Saharan Africa: South Sudan (8.2%). Figures are 2026 IMF projections unless another year is shown. Regions follow the World Bank's groups.
Are these figures forecasts?
188 of the 191 figures are IMF projections: forecasts for a year that has not ended, from the World Economic Outlook, revised at each release, not measured values. Each row shows its own year.
Use and cite this data
- The download button above saves this table's rows as CSV, filtered and in the order shown. The API also serves this indicator as CSV: statisticsoftheworld.com/api/v1/rankings/IMF.BCA_NGDPD?format=csv. It lists the stored latest figures highest first under the publisher's country names and can include the World aggregate, so its rows and ranks can differ from this table.
- Licence: IMF Terms. Review the IMF Terms for the intended use; IMF data is also available free of charge from the IMF. Source terms.
- The map above can be embedded: open "Embed this map" under it for code that links back to this page.
- Each country has its own row link, such as https://statisticsoftheworld.com/ranking/current-account#MAC.
- Spotted an error? Report a data correction. How to cite: citation guide.
Statistics of the World. Current Account Balance by Country: 2026 Rankings. Data: IMF World Economic Outlook, October 2026 edition, figures for 2025 to 2026. https://statisticsoftheworld.com/ranking/current-account
Use this data programmatically
Fetch the same 191-country ranking as JSON or CSV: fresh on every request, drop-in for dashboards, scripts, and notebooks. 1,000 free requests/day, no signup needed; sign up for usage tracking and 50,000/day on Pro.
curl 'https://statisticsoftheworld.com/api/v1/rankings/IMF.BCA_NGDPD?format=csv' \
  -o current-account.csv