
Age Dependency Ratio by Country: 2025 World Rankings
Age dependency ratio is the ratio of dependents, people younger than 15 or older than 64, to the working-age population, those ages 15-64. Data are shown as the proportion of dependents per 100 working-age population. Data from the World Bank.
The Central African Republic has the highest age dependency ratio: 103.6% in 2025. Next are Monaco (99.1%), Somalia (96.7%), DR Congo (96.2%) and Niger (95.5%). Qatar has the lowest age dependency ratio: 20.0% in 2025. The median across the 217 countries is 55.1%, counting each country once, so it is not a world average.
Source: World Bank World Development Indicators. 217 of 218 countries and territories have a figure. Every figure is for 2025.
- Highest
- 103.6%
- Central African Republic, 2025
- Lowest
- 20.0%
- Qatar, 2025
- Median
- 55.1%
- Counting each country once, so it is not a world average
- Coverage
- 217 of 218
- Countries and territories with a figure; 2025
| # | Country | Age Dependency Ratio (%) | Year | Change since 2015 (pp) |
|---|---|---|---|---|
| 1 | Central African Republic | 103.6% | 2025 | -0.3 pp |
| 2 | Monaco | 99.1% | 2025 | +12.6 pp |
| 3 | Somalia | 96.7% | 2025 | -3.3 pp |
| 4 | DR Congo | 96.2% | 2025 | -0.3 pp |
| 5 | Niger | 95.5% | 2025 | -11.3 pp |
| 6 | Mali | 92.9% | 2025 | -9.6 pp |
| 7 | Chad | 92.6% | 2025 | -9.8 pp |
| 8 | Angola | 88.7% | 2025 | -3.5 pp |
| 9 | Mozambique | 88.3% | 2025 | -5.6 pp |
| 10 | Burundi | 87.0% | 2025 | -10.1 pp |
| 11 | Mauritania | 83.9% | 2025 | -7.6 pp |
| 12 | Tanzania | 83.1% | 2025 | -7.3 pp |
| 13 | Uganda | 82.9% | 2025 | -17.1 pp |
| 14 | Afghanistan | 81.8% | 2025 | -12.8 pp |
| 15 | Benin | 79.9% | 2025 | -6.8 pp |
| 16 | Samoa | 79.0% | 2025 | +3.7 pp |
| 17 | Guinea | 78.6% | 2025 | -9.4 pp |
| 18 | Cameroon | 78.4% | 2025 | -6.8 pp |
| 19 | Togo | 78.3% | 2025 | -5.4 pp |
| 20 | Burkina Faso | 78.1% | 2025 | -14.5 pp |
| 20 | Zimbabwe | 78.1% | 2025 | -10.8 pp |
| 22 | Sudan | 77.3% | 2025 | -8.7 pp |
| 22 | Nigeria | 77.3% | 2025 | -12.4 pp |
| 24 | Yemen | 77.2% | 2025 | -3.1 pp |
| 25 | Côte d'Ivoire | 75.8% | 2025 | -5.2 pp |
| 26 | Republic of the Congo | 75.5% | 2025 | -4.9 pp |
| 27 | Zambia | 75.3% | 2025 | -13.0 pp |
| 28 | The Gambia | 75.2% | 2025 | -10.6 pp |
| 29 | Malawi | 74.6% | 2025 | -19.6 pp |
| 30 | Liberia | 73.7% | 2025 | -10.1 pp |
| 31 | Madagascar | 73.6% | 2025 | -7.4 pp |
| 32 | Vanuatu | 73.4% | 2025 | +0.2 pp |
| 33 | Ethiopia | 72.6% | 2025 | -11.8 pp |
| 34 | Eritrea | 72.0% | 2025 | -13.4 pp |
| 35 | Tonga | 71.7% | 2025 | -2.9 pp |
| 36 | Guinea-Bissau | 71.1% | 2025 | -10.9 pp |
| 37 | West Bank and Gaza | 70.8% | 2025 | -5.7 pp |
| 38 | Sao Tome and Principe | 70.6% | 2025 | -12.8 pp |
| 38 | Senegal | 70.6% | 2025 | -14.2 pp |
| 40 | Comoros | 70.4% | 2025 | -8.4 pp |
| 41 | Japan | 70.2% | 2025 | +4.1 pp |
| 42 | South Sudan | 69.7% | 2025 | -14.2 pp |
| 43 | Rwanda | 69.6% | 2025 | -9.3 pp |
| 44 | Sierra Leone | 69.3% | 2025 | -12.5 pp |
| 45 | Equatorial Guinea | 69.1% | 2025 | -2.1 pp |
| 46 | Saint Martin | 68.7% | 2025 | +18.3 pp |
| 47 | Pakistan | 68.4% | 2025 | -5.8 pp |
| 48 | Namibia | 67.9% | 2025 | +1.1 pp |
| 49 | Gabon | 67.7% | 2025 | -0.6 pp |
| 50 | Solomon Islands | 67.3% | 2025 | -9.6 pp |
| 51 | Nauru | 67.1% | 2025 | +1.2 pp |
| 52 | Tuvalu | 66.8% | 2025 | +7.2 pp |
| 53 | Tajikistan | 66.5% | 2025 | +1.8 pp |
| 54 | Israel | 66.3% | 2025 | +1.6 pp |
| 55 | U.S. Virgin Islands | 65.5% | 2025 | +7.3 pp |
| 56 | Iraq | 65.2% | 2025 | -11.5 pp |
| 57 | Kenya | 64.7% | 2025 | -15.3 pp |
| 58 | Ghana | 64.5% | 2025 | -7.8 pp |
| 59 | Guam | 63.8% | 2025 | +10.9 pp |
| 60 | Marshall Islands | 63.3% | 2025 | -4.1 pp |
| 60 | France | 63.3% | 2025 | +4.3 pp |
| 62 | Kiribati | 63.2% | 2025 | -0.3 pp |
| 63 | Finland | 62.7% | 2025 | +5.0 pp |
| 64 | Timor-Leste | 62.2% | 2025 | -17.6 pp |
| 65 | Kazakhstan | 61.7% | 2025 | +9.1 pp |
| 66 | Lesotho | 61.2% | 2025 | -6.9 pp |
| 67 | Kyrgyzstan | 61.0% | 2025 | +2.8 pp |
| 68 | Micronesia | 60.5% | 2025 | -0.6 pp |
| 69 | Portugal | 60.4% | 2025 | +6.9 pp |
| 69 | Faroe Islands | 60.4% | 2025 | -0.8 pp |
| 71 | Sweden | 60.3% | 2025 | +1.5 pp |
| 72 | Germany | 60.2% | 2025 | +8.1 pp |
| 73 | Isle of Man | 60.0% | 2025 | +2.9 pp |
| 74 | Latvia | 59.7% | 2025 | +6.7 pp |
| 75 | Uzbekistan | 59.6% | 2025 | +10.3 pp |
| 75 | Eswatini | 59.6% | 2025 | -7.6 pp |
| 77 | Croatia | 59.5% | 2025 | +8.3 pp |
| 77 | Serbia | 59.5% | 2025 | +9.8 pp |
| 79 | Greece | 59.4% | 2025 | +4.2 pp |
| 80 | Estonia | 58.9% | 2025 | +5.3 pp |
| 81 | Mongolia | 58.7% | 2025 | +8.6 pp |
| 82 | Egypt | 58.3% | 2025 | -3.7 pp |
| 83 | Italy | 58.1% | 2025 | +2.5 pp |
| 83 | Papua New Guinea | 58.1% | 2025 | -6.0 pp |
| 83 | Algeria | 58.1% | 2025 | +6.0 pp |
| 86 | Slovenia | 58.0% | 2025 | +9.1 pp |
| 87 | Denmark | 57.9% | 2025 | +2.6 pp |
| 87 | United Kingdom | 57.9% | 2025 | +2.5 pp |
| 87 | Belgium | 57.9% | 2025 | +3.7 pp |
| 90 | Bulgaria | 57.8% | 2025 | +6.0 pp |
| 91 | Puerto Rico | 57.5% | 2025 | +4.7 pp |
| 92 | Georgia | 57.4% | 2025 | +6.9 pp |
| 93 | Moldova | 57.2% | 2025 | +14.5 pp |
| 94 | Czechia | 56.9% | 2025 | +6.8 pp |
| 95 | Montenegro | 56.7% | 2025 | +7.4 pp |
| 96 | Botswana | 56.3% | 2025 | -4.7 pp |
| 96 | Lebanon | 56.3% | 2025 | +8.0 pp |
| 96 | Turkmenistan | 56.3% | 2025 | +6.4 pp |
| 99 | Guatemala | 56.2% | 2025 | -12.0 pp |
| 99 | Bermuda | 56.2% | 2025 | +10.4 pp |
| 101 | Guyana | 56.0% | 2025 | +0.8 pp |
| 102 | Cambodia | 55.9% | 2025 | -1.5 pp |
| 103 | Netherlands | 55.8% | 2025 | +3.3 pp |
| 104 | Australia | 55.7% | 2025 | +4.6 pp |
| 105 | Bosnia and Herzegovina | 55.5% | 2025 | +9.5 pp |
| 105 | Romania | 55.5% | 2025 | +6.5 pp |
| 107 | Liechtenstein | 55.3% | 2025 | +9.6 pp |
| 108 | Haiti | 55.2% | 2025 | -7.2 pp |
| 109 | Hungary | 55.1% | 2025 | +6.8 pp |
| 110 | New Zealand | 55.0% | 2025 | +2.5 pp |
| 110 | United States | 55.0% | 2025 | +4.6 pp |
| 112 | Gibraltar | 54.9% | 2025 | -0.1 pp |
| 113 | Switzerland | 54.6% | 2025 | +5.9 pp |
| 114 | Austria | 54.4% | 2025 | +5.7 pp |
| 114 | Canada | 54.4% | 2025 | +6.8 pp |
| 114 | Lithuania | 54.4% | 2025 | +4.0 pp |
| 114 | Poland | 54.4% | 2025 | +10.5 pp |
| 118 | Bolivia | 54.3% | 2025 | -7.5 pp |
| 119 | Paraguay | 54.1% | 2025 | -1.5 pp |
| 120 | North Macedonia | 54.0% | 2025 | +8.1 pp |
| 121 | Norway | 53.9% | 2025 | +1.8 pp |
| 122 | San Marino | 53.8% | 2025 | +3.7 pp |
| 123 | Jordan | 53.7% | 2025 | -7.9 pp |
| 123 | Venezuela | 53.7% | 2025 | +0.5 pp |
| 125 | American Samoa | 53.6% | 2025 | -5.1 pp |
| 126 | Russia | 53.4% | 2025 | +9.8 pp |
| 126 | Honduras | 53.4% | 2025 | -8.8 pp |
| 128 | Nepal | 53.1% | 2025 | -9.6 pp |
| 129 | Laos | 53.0% | 2025 | -6.6 pp |
| 130 | Slovakia | 52.9% | 2025 | +11.1 pp |
| 131 | Channel Islands | 52.6% | 2025 | +3.8 pp |
| 132 | Dominican Republic | 52.4% | 2025 | -1.3 pp |
| 133 | Bangladesh | 52.2% | 2025 | -4.2 pp |
| 133 | Ireland | 52.2% | 2025 | -0.3 pp |
| 133 | Aruba | 52.2% | 2025 | +7.9 pp |
| 136 | Spain | 52.1% | 2025 | +1.7 pp |
| 137 | Albania | 52.0% | 2025 | +6.0 pp |
| 138 | Panama | 51.9% | 2025 | -2.2 pp |
| 138 | Uruguay | 51.9% | 2025 | -3.7 pp |
| 138 | Sri Lanka | 51.9% | 2025 | +1.1 pp |
| 138 | Belarus | 51.9% | 2025 | +8.1 pp |
| 138 | Barbados | 51.9% | 2025 | +4.6 pp |
| 143 | Nicaragua | 51.5% | 2025 | -6.9 pp |
| 143 | Hong Kong | 51.5% | 2025 | +14.6 pp |
| 145 | Djibouti | 51.0% | 2025 | -10.7 pp |
| 146 | Argentina | 50.7% | 2025 | -5.3 pp |
| 146 | Morocco | 50.7% | 2025 | -0.5 pp |
| 148 | Suriname | 50.4% | 2025 | -3.0 pp |
| 148 | Tunisia | 50.4% | 2025 | +4.0 pp |
| 148 | Iceland | 50.4% | 2025 | -0.9 pp |
| 151 | Fiji | 50.3% | 2025 | -3.2 pp |
| 152 | Malta | 50.2% | 2025 | +2.0 pp |
| 152 | Armenia | 50.2% | 2025 | +5.2 pp |
| 154 | Syria | 49.9% | 2025 | -31.0 pp |
| 155 | St. Vincent and the Grenadines | 49.5% | 2025 | -0.2 pp |
| 156 | Peru | 49.4% | 2025 | -6.1 pp |
| 157 | New Caledonia | 49.0% | 2025 | -0.3 pp |
| 158 | Philippines | 48.9% | 2025 | -10.6 pp |
| 159 | El Salvador | 48.6% | 2025 | -7.0 pp |
| 160 | Ukraine | 48.5% | 2025 | +5.2 pp |
| 161 | Mexico | 48.4% | 2025 | -4.6 pp |
| 161 | South Africa | 48.4% | 2025 | -2.4 pp |
| 163 | Ecuador | 48.1% | 2025 | -7.4 pp |
| 164 | Vietnam | 47.8% | 2025 | +4.1 pp |
| 165 | Greenland | 47.6% | 2025 | +7.1 pp |
| 166 | Cuba | 47.2% | 2025 | +2.5 pp |
| 167 | Libya | 47.1% | 2025 | -7.9 pp |
| 167 | Northern Mariana Islands | 47.1% | 2025 | +4.7 pp |
| 169 | Curaçao | 46.9% | 2025 | -1.7 pp |
| 170 | Cabo Verde | 46.7% | 2025 | -4.6 pp |
| 171 | Indonesia | 46.6% | 2025 | -2.8 pp |
| 172 | North Korea | 46.3% | 2025 | +1.9 pp |
| 172 | Grenada | 46.3% | 2025 | -1.7 pp |
| 174 | Myanmar | 46.2% | 2025 | -1.1 pp |
| 174 | Türkiye | 46.2% | 2025 | +0.2 pp |
| 176 | India | 46.1% | 2025 | -6.3 pp |
| 176 | Luxembourg | 46.1% | 2025 | +1.7 pp |
| 178 | Belize | 46.0% | 2025 | -10.1 pp |
| 179 | Chile | 45.2% | 2025 | -0.1 pp |
| 180 | Costa Rica | 45.1% | 2025 | -0.5 pp |
| 181 | Cyprus | 45.0% | 2025 | +5.1 pp |
| 182 | Brazil | 44.6% | 2025 | +1.1 pp |
| 183 | Dominica | 44.5% | 2025 | -1.1 pp |
| 184 | Iran | 44.1% | 2025 | +2.1 pp |
| 185 | South Korea | 44.0% | 2025 | +7.5 pp |
| 186 | Kosovo | 43.9% | 2025 | -6.4 pp |
| 187 | Thailand | 43.7% | 2025 | +4.0 pp |
| 187 | Trinidad and Tobago | 43.7% | 2025 | +5.6 pp |
| 187 | French Polynesia | 43.7% | 2025 | -2.2 pp |
| 190 | Azerbaijan | 43.6% | 2025 | +2.3 pp |
| 191 | China | 43.5% | 2025 | +3.9 pp |
| 192 | Colombia | 43.3% | 2025 | -2.9 pp |
| 193 | St. Kitts and Nevis | 43.0% | 2025 | +3.6 pp |
| 194 | Antigua and Barbuda | 42.5% | 2025 | +1.1 pp |
| 195 | Palau | 42.4% | 2025 | +3.8 pp |
| 196 | Bahamas | 42.1% | 2025 | -3.8 pp |
| 197 | Malaysia | 41.5% | 2025 | -4.5 pp |
| 198 | Sint Maarten | 41.4% | 2025 | +3.8 pp |
| 199 | Macao | 40.5% | 2025 | +12.8 pp |
| 200 | Mauritius | 40.2% | 2025 | +1.8 pp |
| 201 | Seychelles | 39.9% | 2025 | +0.2 pp |
| 202 | Andorra | 39.2% | 2025 | -0.1 pp |
| 203 | Brunei | 38.6% | 2025 | +0.2 pp |
| 204 | Turks and Caicos Islands | 38.2% | 2025 | +1.1 pp |
| 205 | St. Lucia | 37.4% | 2025 | -3.2 pp |
| 206 | Oman | 37.0% | 2025 | +4.0 pp |
| 206 | Bhutan | 37.0% | 2025 | -11.4 pp |
| 208 | Jamaica | 36.7% | 2025 | -5.7 pp |
| 209 | Saudi Arabia | 36.4% | 2025 | -1.2 pp |
| 210 | Singapore | 35.0% | 2025 | +7.3 pp |
| 211 | Cayman Islands | 34.4% | 2025 | +3.1 pp |
| 212 | British Virgin Islands | 31.9% | 2025 | -3.7 pp |
| 213 | Maldives | 31.6% | 2025 | -5.8 pp |
| 214 | Bahrain | 28.9% | 2025 | -1.1 pp |
| 215 | Kuwait | 26.8% | 2025 | -5.1 pp |
| 216 | United Arab Emirates | 21.6% | 2025 | -0.8 pp |
| 217 | Qatar | 20.0% | 2025 | +2.4 pp |
Each figure in the Age Dependency Ratio (%) column is the latest available for that country, and every one is for 2025. Values are rounded for display; the CSV download has full precision.
No figure: Taiwan.
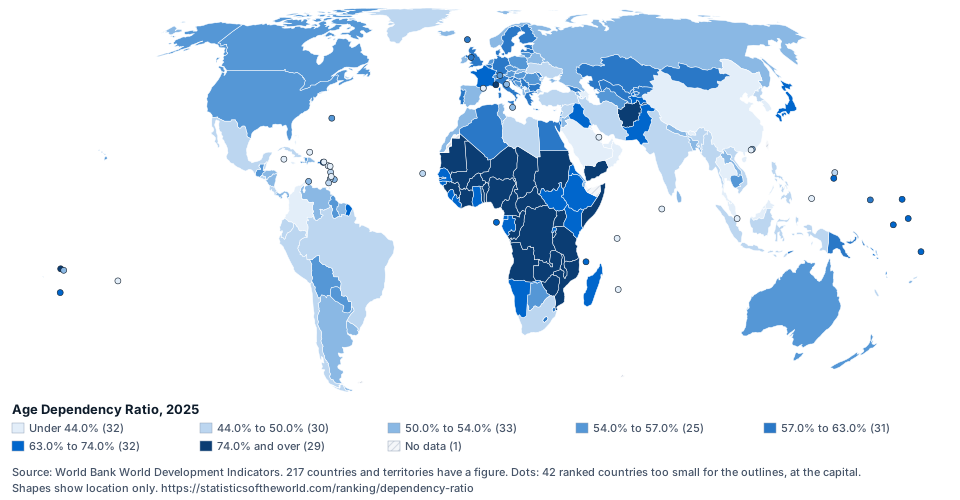
Embed this map
<a href="https://statisticsoftheworld.com/ranking/dependency-ratio"><img src="https://statisticsoftheworld.com/maps/SP.POP.DPND.svg" width="960" height="500" alt="World map of age dependency ratio, 2025. Source: World Bank World Development Indicators."></a>
<p>Source: World Bank World Development Indicators. Map: <a href="https://statisticsoftheworld.com/ranking/dependency-ratio">Statistics of the World</a></p>
Then and now
| # | 2000 | 2015 | 2025 |
|---|---|---|---|
| 1 | Uganda (111.2%) | Niger (106.8%) | Central African Republic (103.6%) |
| 2 | Afghanistan (109.6%) | Central African Republic (103.9%) | Monaco (99.1%) |
| 3 | Yemen (107.5%) | Mali (102.5%) | Somalia (96.7%) |
| 4 | Chad (106.6%) | Chad (102.4%) | DR Congo (96.2%) |
| 5 | Comoros (104.9%) | Somalia (100.1%) | Niger (95.5%) |
| 6 | Burundi (102.7%) | Uganda (100.0%) | Mali (92.9%) |
| 7 | Ethiopia (101.5%) | Burundi (97.1%) | Chad (92.6%) |
| 8 | Zambia (101.5%) | DR Congo (96.5%) | Angola (88.7%) |
| 9 | Somalia (99.8%) | Afghanistan (94.6%) | Mozambique (88.3%) |
| 10 | The Gambia (99.4%) | Malawi (94.2%) | Burundi (87.0%) |
Saint Martin rose the most since 2015, +18.3 pp, among the 217 countries with figures for both 2015 and 2025. Syria fell the most, -31.0 pp.
Rose the most since 2015
- Saint Martin: +18.3 pp
- Hong Kong: +14.6 pp
- Moldova: +14.5 pp
- Macao: +12.8 pp
- Monaco: +12.6 pp
Fell the most since 2015
- Syria: -31.0 pp
- Malawi: -19.6 pp
- Timor-Leste: -17.6 pp
- Uganda: -17.1 pp
- Kenya: -15.3 pp
From the change column: countries whose latest figure is for 2025 and that have a 2015 figure.
By region
| Region | Countries | Highest | Lowest | Median, each country counted once |
|---|---|---|---|---|
| East Asia & Pacific | 37 | Samoa (79.0%) | Singapore (35.0%) | 53.0% |
| Europe & Central Asia | 58 | Monaco (99.1%) | Andorra (39.2%) | 55.7% |
| Latin America & Caribbean | 42 | Saint Martin (68.7%) | British Virgin Islands (31.9%) | 48.5% |
| Middle East, North Africa, Afghanistan & Pakistan | 23 | Afghanistan (81.8%) | Qatar (20.0%) | 50.7% |
| North America | 3 | Bermuda (56.2%) | Canada (54.4%) | 55.0% |
| South Asia | 6 | Nepal (53.1%) | Maldives (31.6%) | 49.0% |
| Sub-Saharan Africa | 48 | Central African Republic (103.6%) | Seychelles (39.9%) | 74.9% |
Where major economies rank
- United States: 55.0% in 2025, rank 110 of 217.
- China: 43.5% in 2025, rank 191 of 217.
- India: 46.1% in 2025, rank 176 of 217.
- Japan: 70.2% in 2025, rank 41 of 217.
- Germany: 60.2% in 2025, rank 72 of 217.
- United Kingdom: 57.9% in 2025, rank 87 of 217.
- France: 63.3% in 2025, rank 60 of 217.
- Brazil: 44.6% in 2025, rank 182 of 217.
- Canada: 54.4% in 2025, rank 114 of 217.
- Nigeria: 77.3% in 2025, rank 22 of 217.
About these figures
Definition. Age dependency ratio is the ratio of dependents, people younger than 15 or older than 64, to the working-age population, those ages 15-64. Data are shown as the proportion of dependents per 100 working-age population. (The publisher's definition of “Age dependency ratio (% of working-age population)”, copied from the World Bank (World Development Indicators) on 2026-09-07.)
Unit. % of working-age population
Coverage. 217 of 218 countries and territories have a figure. Every figure is for 2025.
The median and any other summary on this page count each country once, so they are not world averages. Values are rounded for display; the CSV download has full precision.
The publisher revises past years when it updates the series, so a figure here can change after it first appears.
Questions about these figures
Which country has the highest age dependency ratio?
The Central African Republic has the highest age dependency ratio: 103.6% in 2025. The figures come from the World Bank World Development Indicators.
Which country has the lowest age dependency ratio?
Qatar has the lowest age dependency ratio: 20.0% in 2025.
How many countries are ranked, and for which years?
217 countries and territories have a figure in this ranking. Every figure is for 2025.
What is the median age dependency ratio across countries?
The median is 55.1%: half of the 217 countries are above it and half below. Every figure is for 2025. It counts each country once, so it is not a world average.
Which country's age dependency ratio changed the most since 2015?
Among the 217 countries with figures for both 2015 and 2025, Syria changed the most: -31.0 pp since 2015, to 49.9% in 2025.
Where does the United States rank on age dependency ratio?
The United States ranks 110 of 217, at 55.0% in 2025.
Which country has the highest age dependency ratio in each region?
East Asia & Pacific: Samoa (79.0%); Europe & Central Asia: Monaco (99.1%); Latin America & Caribbean: Saint Martin (68.7%); Middle East, North Africa, Afghanistan & Pakistan: Afghanistan (81.8%); North America: Bermuda (56.2%); South Asia: Nepal (53.1%); Sub-Saharan Africa: the Central African Republic (103.6%). Figures are for 2025 unless another year is shown. Regions follow the World Bank's groups.
Use and cite this data
- The download button above saves this table's rows as CSV, filtered and in the order shown. The API also serves this indicator as CSV: statisticsoftheworld.com/api/v1/rankings/SP.POP.DPND?format=csv. It lists the stored latest figures highest first under the publisher's country names and can include the World aggregate, so its rows and ranks can differ from this table.
- Licence: CC BY 4.0. Attribution is required; dataset-specific notices and third-party restrictions still apply. Source terms.
- The map above can be embedded: open "Embed this map" under it for code that links back to this page.
- Each country has its own row link, such as https://statisticsoftheworld.com/ranking/dependency-ratio#CAF.
- Spotted an error? Report a data correction. How to cite: citation guide.
Statistics of the World. Age Dependency Ratio by Country: 2025 Rankings. Data: World Bank World Development Indicators, figures for 2025. https://statisticsoftheworld.com/ranking/dependency-ratio
Use this data programmatically
Fetch the same 217-country ranking as JSON or CSV: fresh on every request, drop-in for dashboards, scripts, and notebooks. 1,000 free requests/day, no signup needed; sign up for usage tracking and 50,000/day on Pro.
curl 'https://statisticsoftheworld.com/api/v1/rankings/SP.POP.DPND?format=csv' \
  -o dependency-ratio.csv