
Doctors per Capita by Country 2022
Physicians per 1,000 people: generalist and specialist medical practitioners.
Cuba has the highest physicians per 1,000 people: 9.54 in 2021. Next are Monaco (8.61, 2020), Seychelles (6.6), Greece (6.58) and Portugal (5.85). 2 countries share the lowest physicians per 1,000 people, 0.04 (Niger and South Sudan). The median across the 174 countries is 1.75, counting each country once, so it is not a world average.
Source: World Bank World Development Indicators. 174 of 217 countries and territories have a figure. Each country shows its latest available year, from 2019 to 2023. The most common is 2022 (79 of 174 countries).
- Highest
- 9.54
- Cuba, 2021
- Lowest
- 0.04
- 2 countries share it, 2022 or 2023
- Median
- 1.75
- Counting each country once, so it is not a world average
- Coverage
- 174 of 217
- Countries and territories with a figure; latest available, 2019 to 2023
| # | Country | Physicians per 1,000 people | Year |
|---|---|---|---|
| 1 | Cuba | 9.54 | 2021 |
| 2 | Monaco | 8.61 | 2020 |
| 3 | Seychelles | 6.6 | 2022 |
| 4 | Greece | 6.58 | 2022 |
| 5 | Portugal | 5.85 | 2022 |
| 6 | Georgia | 5.64 | 2023 |
| 7 | Austria | 5.51 | 2023 |
| 8 | Russia | 5.11 | 2022 |
| 8 | Argentina | 5.11 | 2023 |
| 10 | Andorra | 5.07 | 2023 |
| 11 | Norway | 4.97 | 2023 |
| 12 | Belarus | 4.72 | 2023 |
| 13 | Uruguay | 4.67 | 2022 |
| 14 | San Marino | 4.63 | 2023 |
| 15 | Germany | 4.53 | 2022 |
| 16 | Malta | 4.51 | 2022 |
| 17 | Denmark | 4.5 | 2021 |
| 18 | Switzerland | 4.48 | 2022 |
| 19 | Lithuania | 4.47 | 2022 |
| 20 | Sweden | 4.41 | 2021 |
| 21 | Iceland | 4.37 | 2023 |
| 22 | Czechia | 4.35 | 2022 |
| 23 | Bulgaria | 4.33 | 2022 |
| 24 | Spain | 4.29 | 2022 |
| 25 | St. Lucia | 4.23 | 2020 |
| 26 | Italy | 4.19 | 2022 |
| 27 | Trinidad and Tobago | 4.16 | 2021 |
| 28 | Mongolia | 4.13 | 2022 |
| 29 | Australia | 4.09 | 2022 |
| 30 | Poland | 4.03 | 2023 |
| 31 | Moldova | 4.02 | 2023 |
| 32 | Croatia | 3.91 | 2022 |
| 33 | Paraguay | 3.89 | 2022 |
| 34 | Netherlands | 3.88 | 2022 |
| 34 | Ireland | 3.88 | 2023 |
| 36 | Israel | 3.8 | 2023 |
| 37 | Kazakhstan | 3.75 | 2023 |
| 38 | Slovakia | 3.7 | 2022 |
| 39 | United States | 3.68 | 2022 |
| 40 | Romania | 3.63 | 2022 |
| 41 | New Zealand | 3.61 | 2022 |
| 41 | Finland | 3.61 | 2021 |
| 43 | Belgium | 3.57 | 2022 |
| 44 | Cyprus | 3.56 | 2022 |
| 45 | Ukraine | 3.53 | 2023 |
| 46 | Estonia | 3.47 | 2022 |
| 47 | Hungary | 3.46 | 2022 |
| 48 | Saudi Arabia | 3.41 | 2023 |
| 49 | Latvia | 3.4 | 2022 |
| 50 | Slovenia | 3.37 | 2022 |
| 51 | Armenia | 3.36 | 2022 |
| 52 | Chile | 3.33 | 2023 |
| 53 | United Kingdom | 3.3 | 2023 |
| 54 | France | 3.28 | 2022 |
| 55 | Azerbaijan | 3.19 | 2022 |
| 56 | China | 3.11 | 2022 |
| 57 | Serbia | 3.1 | 2022 |
| 58 | Qatar | 3.02 | 2023 |
| 59 | United Arab Emirates | 2.99 | 2023 |
| 60 | Barbados | 2.96 | 2022 |
| 61 | North Macedonia | 2.94 | 2022 |
| 62 | Jordan | 2.85 | 2022 |
| 63 | Singapore | 2.83 | 2022 |
| 64 | Canada | 2.82 | 2023 |
| 65 | Uzbekistan | 2.81 | 2021 |
| 66 | Montenegro | 2.78 | 2023 |
| 67 | Costa Rica | 2.69 | 2022 |
| 68 | Lebanon | 2.68 | 2020 |
| 69 | Japan | 2.65 | 2022 |
| 70 | South Korea | 2.61 | 2022 |
| 71 | Mexico | 2.59 | 2022 |
| 72 | Bosnia and Herzegovina | 2.58 | 2019 |
| 73 | Colombia | 2.54 | 2023 |
| 74 | Dominican Republic | 2.43 | 2023 |
| 75 | Brazil | 2.36 | 2023 |
| 76 | Malaysia | 2.34 | 2023 |
| 77 | Ecuador | 2.31 | 2020 |
| 78 | Kuwait | 2.27 | 2020 |
| 79 | Türkiye | 2.24 | 2022 |
| 80 | Maldives | 2.23 | 2019 |
| 81 | Oman | 1.99 | 2022 |
| 82 | Turkmenistan | 1.93 | 2023 |
| 83 | Brunei | 1.89 | 2021 |
| 84 | Albania | 1.88 | 2020 |
| 85 | Tajikistan | 1.87 | 2023 |
| 86 | Iran | 1.81 | 2023 |
| 86 | Palau | 1.81 | 2023 |
| 88 | Peru | 1.69 | 2023 |
| 89 | Algeria | 1.66 | 2022 |
| 90 | Panama | 1.63 | 2022 |
| 91 | El Salvador | 1.62 | 2023 |
| 92 | Kyrgyzstan | 1.57 | 2023 |
| 93 | Syria | 1.52 | 2021 |
| 94 | Mauritius | 1.44 | 2022 |
| 95 | Guyana | 1.39 | 2020 |
| 96 | Suriname | 1.35 | 2023 |
| 96 | Tuvalu | 1.35 | 2020 |
| 98 | Tunisia | 1.31 | 2021 |
| 99 | Bolivia | 1.28 | 2021 |
| 99 | Guatemala | 1.28 | 2020 |
| 101 | Pakistan | 1.16 | 2021 |
| 102 | Sri Lanka | 1.14 | 2023 |
| 103 | Vietnam | 1.11 | 2021 |
| 104 | Iraq | 1.02 | 2022 |
| 105 | Tonga | 1.01 | 2021 |
| 105 | Nepal | 1.01 | 2023 |
| 107 | Micronesia | 0.97 | 2020 |
| 108 | South Africa | 0.79 | 2022 |
| 108 | Philippines | 0.79 | 2021 |
| 110 | Myanmar | 0.76 | 2019 |
| 111 | Timor-Leste | 0.75 | 2020 |
| 112 | Bahrain | 0.74 | 2020 |
| 112 | Morocco | 0.74 | 2021 |
| 114 | Cabo Verde | 0.73 | 2023 |
| 115 | India | 0.72 | 2020 |
| 115 | Bangladesh | 0.72 | 2023 |
| 117 | Egypt | 0.67 | 2020 |
| 118 | Samoa | 0.56 | 2021 |
| 118 | Eswatini | 0.56 | 2023 |
| 120 | Bhutan | 0.55 | 2022 |
| 120 | Namibia | 0.55 | 2022 |
| 122 | Thailand | 0.54 | 2021 |
| 123 | Indonesia | 0.52 | 2023 |
| 123 | Gabon | 0.52 | 2022 |
| 125 | Honduras | 0.49 | 2020 |
| 126 | Sao Tome and Principe | 0.46 | 2022 |
| 126 | Jamaica | 0.46 | 2023 |
| 128 | Comoros | 0.42 | 2022 |
| 129 | Nigeria | 0.38 | 2023 |
| 129 | Botswana | 0.38 | 2023 |
| 131 | Laos | 0.33 | 2022 |
| 132 | Zambia | 0.32 | 2022 |
| 132 | Afghanistan | 0.32 | 2023 |
| 134 | Haiti | 0.29 | 2022 |
| 134 | Kenya | 0.29 | 2023 |
| 136 | Ghana | 0.27 | 2023 |
| 137 | Mauritania | 0.26 | 2022 |
| 138 | Guinea-Bissau | 0.25 | 2022 |
| 139 | Angola | 0.24 | 2022 |
| 139 | Solomon Islands | 0.24 | 2023 |
| 141 | Lesotho | 0.23 | 2022 |
| 142 | Benin | 0.22 | 2023 |
| 143 | Cambodia | 0.21 | 2019 |
| 143 | Djibouti | 0.21 | 2022 |
| 143 | Guinea | 0.21 | 2022 |
| 143 | DR Congo | 0.21 | 2022 |
| 147 | Uganda | 0.19 | 2022 |
| 147 | Mali | 0.19 | 2023 |
| 149 | Liberia | 0.18 | 2022 |
| 150 | Mozambique | 0.17 | 2022 |
| 150 | Republic of the Congo | 0.17 | 2022 |
| 150 | Madagascar | 0.17 | 2022 |
| 150 | Côte d'Ivoire | 0.17 | 2023 |
| 154 | Vanuatu | 0.16 | 2019 |
| 155 | Equatorial Guinea | 0.15 | 2022 |
| 155 | Burkina Faso | 0.15 | 2022 |
| 157 | Ethiopia | 0.14 | 2023 |
| 157 | Cameroon | 0.14 | 2022 |
| 157 | Zimbabwe | 0.14 | 2023 |
| 160 | Sierra Leone | 0.13 | 2022 |
| 160 | Tanzania | 0.13 | 2022 |
| 162 | Senegal | 0.11 | 2023 |
| 163 | Yemen | 0.1 | 2023 |
| 164 | Rwanda | 0.09 | 2022 |
| 164 | The Gambia | 0.09 | 2023 |
| 164 | Eritrea | 0.09 | 2022 |
| 164 | Chad | 0.09 | 2023 |
| 168 | Togo | 0.08 | 2022 |
| 168 | Burundi | 0.08 | 2022 |
| 170 | Central African Republic | 0.07 | 2023 |
| 171 | Papua New Guinea | 0.06 | 2023 |
| 172 | Malawi | 0.05 | 2022 |
| 173 | South Sudan | 0.04 | 2022 |
| 173 | Niger | 0.04 | 2023 |
Each figure is the latest available for that country, so rows can refer to different years; compare years before comparing values. Values are rounded for display; the CSV download has full precision.
43 countries and territories have no figure
American Samoa, Antigua and Barbuda, Aruba, Bahamas, Belize, Bermuda, British Virgin Islands, Cayman Islands, Channel Islands, Curaçao, Dominica, Faroe Islands, Fiji, French Polynesia, Gibraltar, Greenland, Grenada, Guam, Hong Kong, Isle of Man, Kiribati, Kosovo, Libya, Liechtenstein, Luxembourg, Macao, Marshall Islands, Nauru, New Caledonia, Nicaragua, North Korea, Northern Mariana Islands, Puerto Rico, Saint Martin, Sint Maarten, Somalia, St. Kitts and Nevis, St. Vincent and the Grenadines, Sudan, Turks and Caicos Islands, U.S. Virgin Islands, Venezuela, West Bank and Gaza.
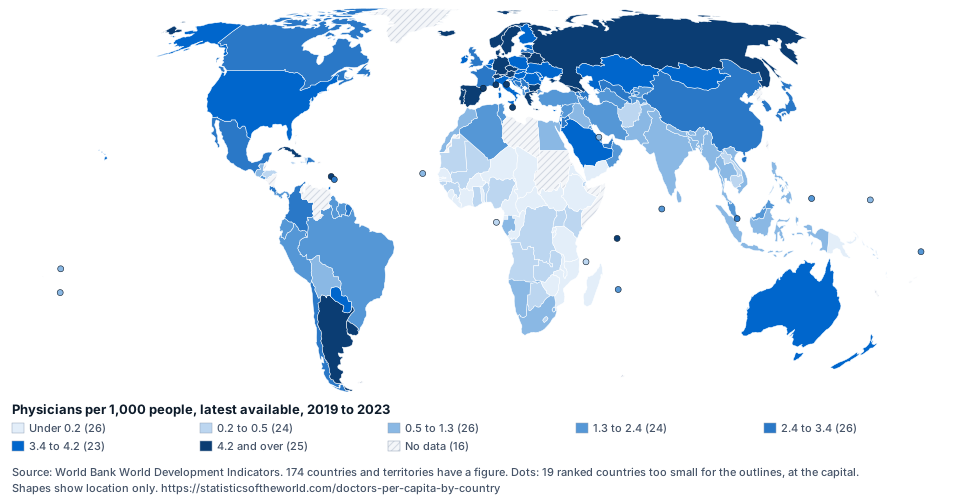
Embed this map
<a href="https://statisticsoftheworld.com/doctors-per-capita-by-country"><img src="https://statisticsoftheworld.com/maps/SH.MED.PHYS.ZS.svg" width="960" height="500" alt="World map of physicians per 1,000 people, latest available, 2019 to 2023. Source: World Bank World Development Indicators."></a>
<p>Source: World Bank World Development Indicators. Map: <a href="https://statisticsoftheworld.com/doctors-per-capita-by-country">Statistics of the World</a></p>
By region
| Region | Countries | Highest | Lowest | Median, each country counted once |
|---|---|---|---|---|
| East Asia & Pacific | 25 | Mongolia (4.13) | Papua New Guinea (0.06, 2023) | 1.01 |
| Europe & Central Asia | 50 | Monaco (8.61, 2020) | Kyrgyzstan (1.57, 2023) | 3.81 |
| Latin America & Caribbean | 24 | Cuba (9.54, 2021) | Haiti (0.29) | 2.39 |
| Middle East, North Africa, Afghanistan & Pakistan | 21 | Malta (4.51) | Yemen (0.1, 2023) | 1.66 |
| North America | 2 | United States (3.68) | Canada (2.82, 2023) | 3.25 |
| South Asia | 6 | Maldives (2.23, 2019) | Bhutan (0.55) | 0.87 |
| Sub-Saharan Africa | 46 | Seychelles (6.6) | South Sudan (0.04) and Niger (0.04, 2023) | 0.18 |
Where major economies rank
- United States: 3.68 in 2022, rank 39 of 174.
- China: 3.11 in 2022, rank 56 of 174.
- India: 0.72 in 2020, rank 115 of 174.
- Japan: 2.65 in 2022, rank 69 of 174.
- Germany: 4.53 in 2022, rank 15 of 174.
- United Kingdom: 3.3 in 2023, rank 53 of 174.
- France: 3.28 in 2022, rank 54 of 174.
- Brazil: 2.36 in 2023, rank 75 of 174.
- Canada: 2.82 in 2023, rank 64 of 174.
- Nigeria: 0.38 in 2023, rank 129 of 174.
About doctors per capita
The figures come from the World Health Organization’s National Health Workforce Accounts and national sources, published by the World Bank, and the latest year differs from country to country. Some countries count every licensed doctor, others only those who practise, so the figures are not strictly comparable.
Nurses, midwives and community health workers, who provide much of the care in many countries, are not included.
About these figures
Definition. Physicians include generalist and specialist medical practitioners. (The publisher's definition of “Physicians (per 1,000 people)”, copied from the World Bank (World Development Indicators) on 2026-09-07.)
Unit. per 1,000 people
Coverage. 174 of 217 countries and territories have a figure. Each country shows its latest available year, from 2019 to 2023. The most common is 2022 (79 of 174 countries).
The median and any other summary on this page count each country once, so they are not world averages. Values are rounded for display; the CSV download has full precision.
The publisher revises past years when it updates the series, so a figure here can change after it first appears.
Questions about these figures
Which country has the highest physicians per 1,000 people?
Cuba has the highest physicians per 1,000 people: 9.54 in 2021. The figures come from the World Bank World Development Indicators.
Which country has the lowest physicians per 1,000 people?
2 countries share the lowest physicians per 1,000 people, 0.04 (Niger and South Sudan). Their figures are for 2022 and 2023.
How many countries are ranked, and for which years?
174 countries and territories have a figure in this ranking. Each country shows its latest available year, from 2019 to 2023. The most common is 2022 (79 of 174 countries).
What is the median physicians per 1,000 people across countries?
The median is 1.75: half of the 174 countries are above it and half below. The most common year of the figures is 2022. It counts each country once, so it is not a world average.
Where does the United States rank on physicians per 1,000 people?
The United States ranks 39 of 174, at 3.68 in 2022.
Which country has the highest physicians per 1,000 people in each region?
East Asia & Pacific: Mongolia (4.13); Europe & Central Asia: Monaco (8.61, 2020); Latin America & Caribbean: Cuba (9.54, 2021); Middle East, North Africa, Afghanistan & Pakistan: Malta (4.51); North America: the United States (3.68); South Asia: the Maldives (2.23, 2019); Sub-Saharan Africa: Seychelles (6.6). Figures are for 2022 unless another year is shown. Regions follow the World Bank's groups.
Use and cite this data
- The download button above saves this table's rows as CSV, filtered and in the order shown. The API also serves this indicator as CSV: statisticsoftheworld.com/api/v1/rankings/SH.MED.PHYS.ZS?format=csv. It lists the stored latest figures highest first under the publisher's country names and can include the World aggregate, so its rows and ranks can differ from this table.
- Licence: CC BY 4.0. Attribution is required; dataset-specific notices and third-party restrictions still apply. Source terms.
- The map above can be embedded: open "Embed this map" under it for code that links back to this page.
- Each country has its own row link, such as https://statisticsoftheworld.com/doctors-per-capita-by-country#CUB.
- Spotted an error? Report a data correction. How to cite: citation guide.
Statistics of the World. Doctors per Capita by Country: 2022 Rankings. Data: World Bank World Development Indicators, figures for 2019 to 2023. https://statisticsoftheworld.com/doctors-per-capita-by-country